
Last week: Nielsen’s Gauge
This week: Comscore’s 2022 State of Streaming
Flashback: 2021, 2019 and 2018
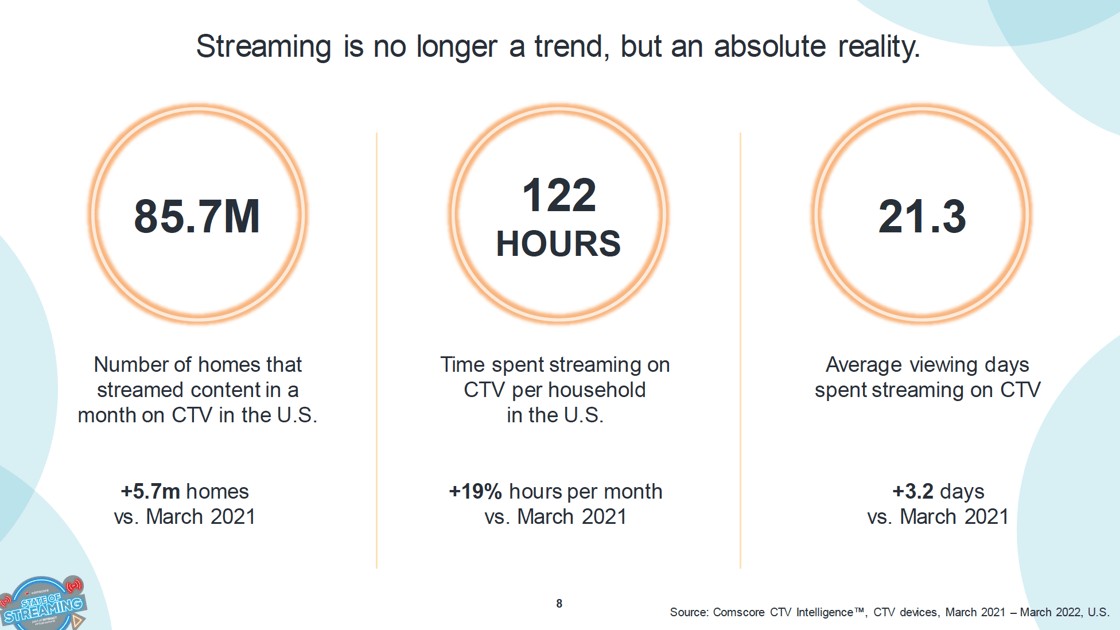
Big question #1: How many streaming households are in the U.S.?
Streaming households (YoY growth) according to Comscore:
1) 2021 – 80.0M
2) 2022 – 85.7M (↑ 7%)
Monthly hours viewed per streaming household:
1) 2021 – 103
2) 2022 – 122 (↑ 19%)
Monthly days spent streaming per household:
1) 2021 – 18.1
2) 2022 – 21.3 (↑ 18%)
Share of U.S. TV households who stream daily according to Leichtman Research Group:
1) 2012 – 4%
2) 2017 – 25%
3) 2020 – 40%
4) 2022 – 46%
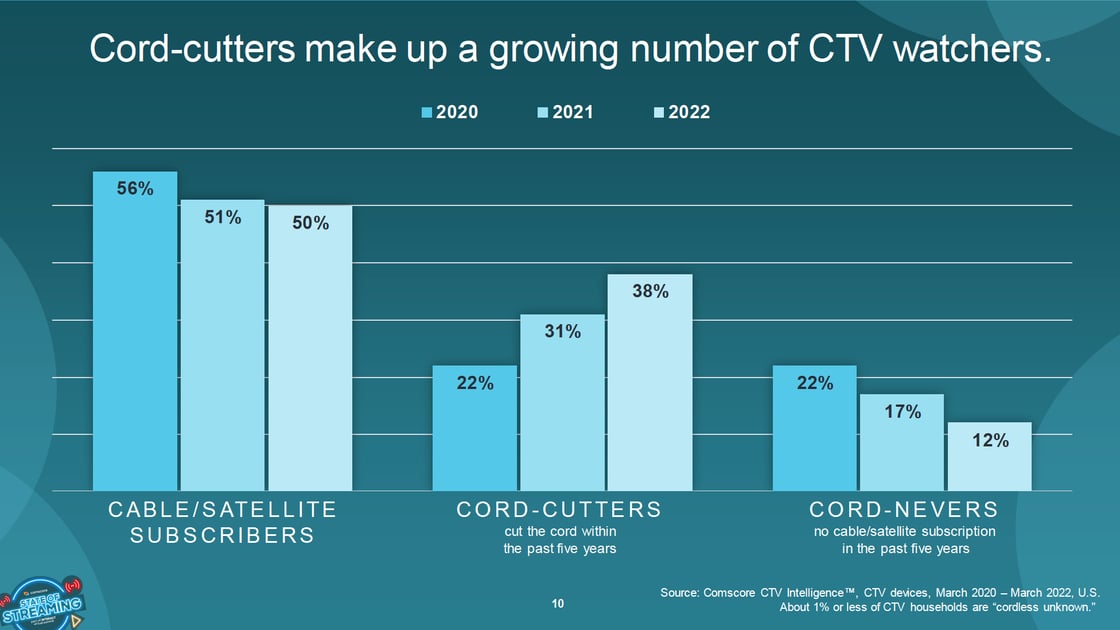
Big question #2: What share of households still have traditional pay-TV?
Share of U.S. households with traditional pay-TV:
1) 2018 – 66%
2) 2019 – 64%
3) 2020 – 56%
4) 2021 – 51%
5) 2022 – 50%
Pay-TV status for U.S. TV households:
1) Traditional pay-TV – 50%
2) Cord-cutter – 38%
3) Cord-never – 12%
Big question #3: How many streaming devices are in the U.S.?
Streaming devices in the U.S., according to Leichtman Research Group:
1) 2017 – 300M
2) 2022 – 500M (↑ 66%)
YoY growth rate for streaming devices by type:
1) Smart TVs – ↑ 48%
2) Streaming boxes/sticks – ↑ 14%
3) All streaming devices – ↑ 21%
4) Gaming consoles – ↓ 20%
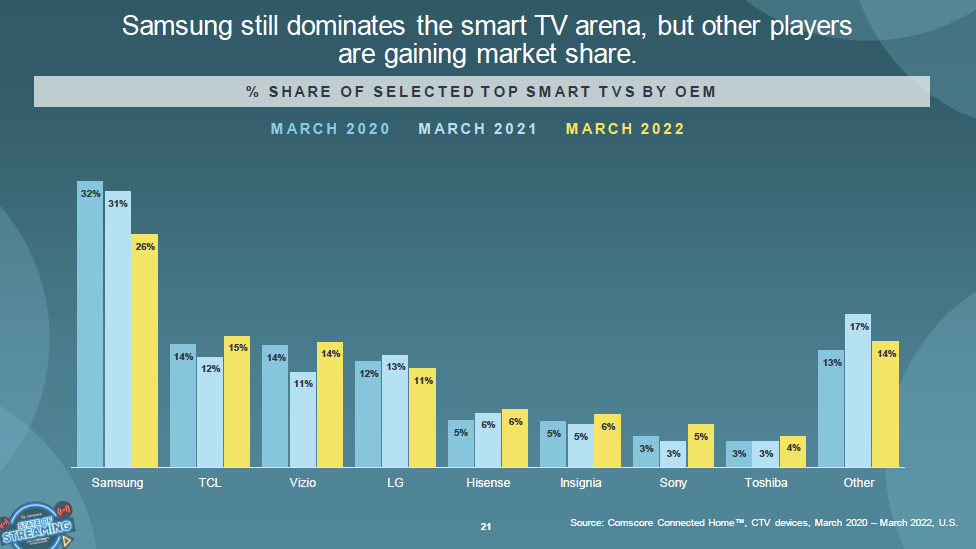
Big question #4: Which smart TV manufacturers account for the largest share?
Top smart TV manufacturers:
1) Samsung – 26%
2) TCL – 15%
3) Vizio – 14%
4) LG – 11%
5) Hisense – 6%
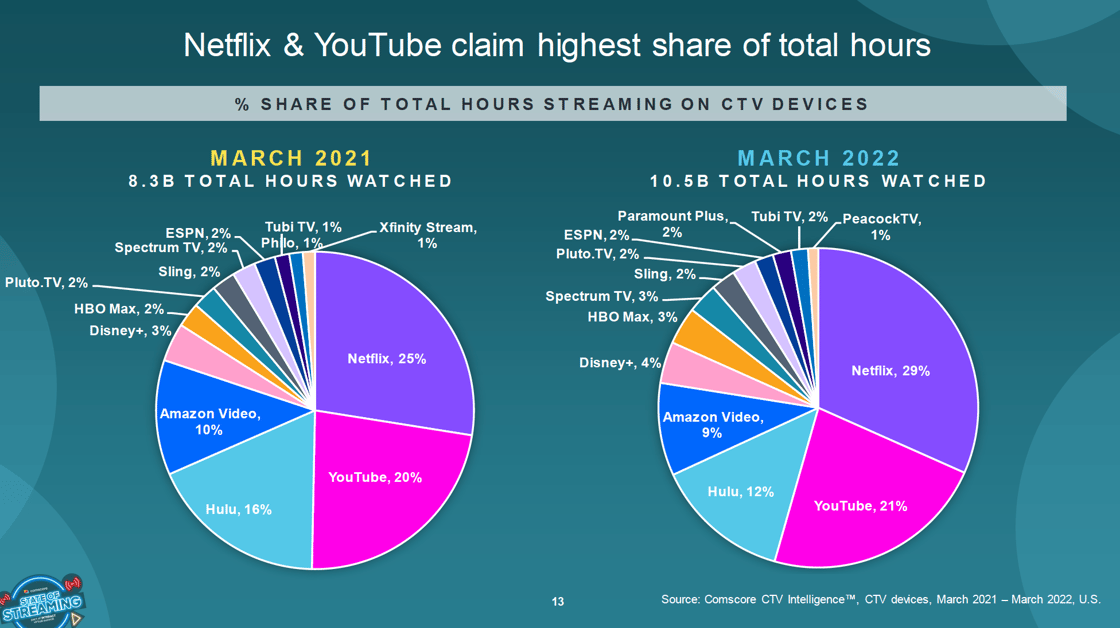
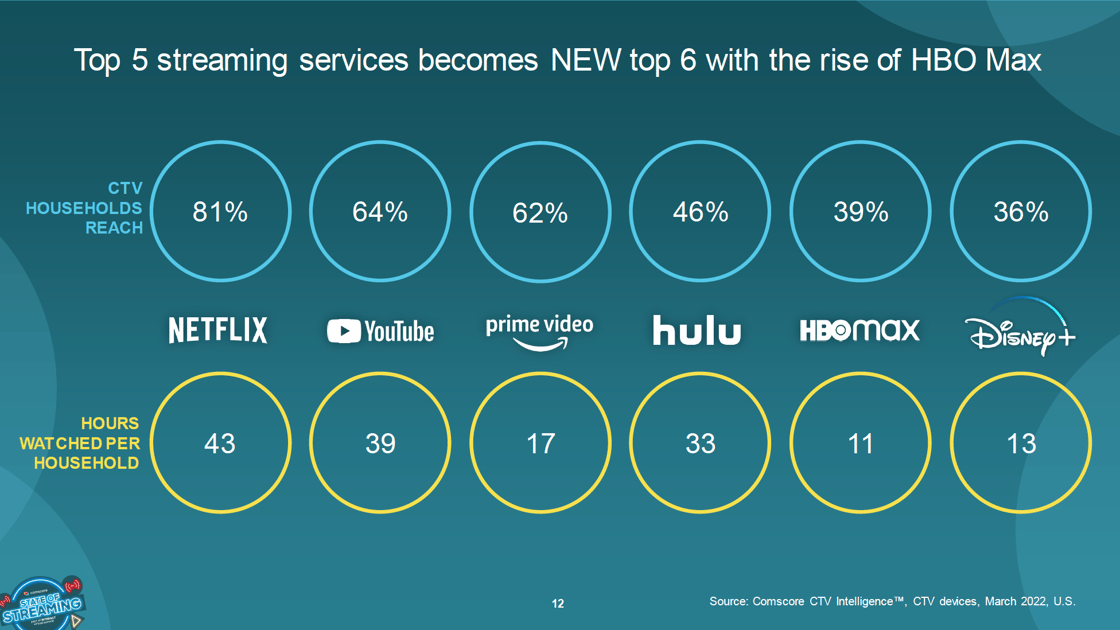
Big question #5: Which streaming services account for largest share of viewing time?
Streaming share of time spent by network:
1) Netflix – 29%
2) YouTube – 21%
3) Hulu – 12%
4) Amazon Prime Video – 9%
5) Disney+ – 4%
Monthly hours watched per subscribed household:
1) Netflix – 43
2) YouTube – 39
3) Hulu – 33
4) Amazon Prime Video – 17
5) Disney+ – 13
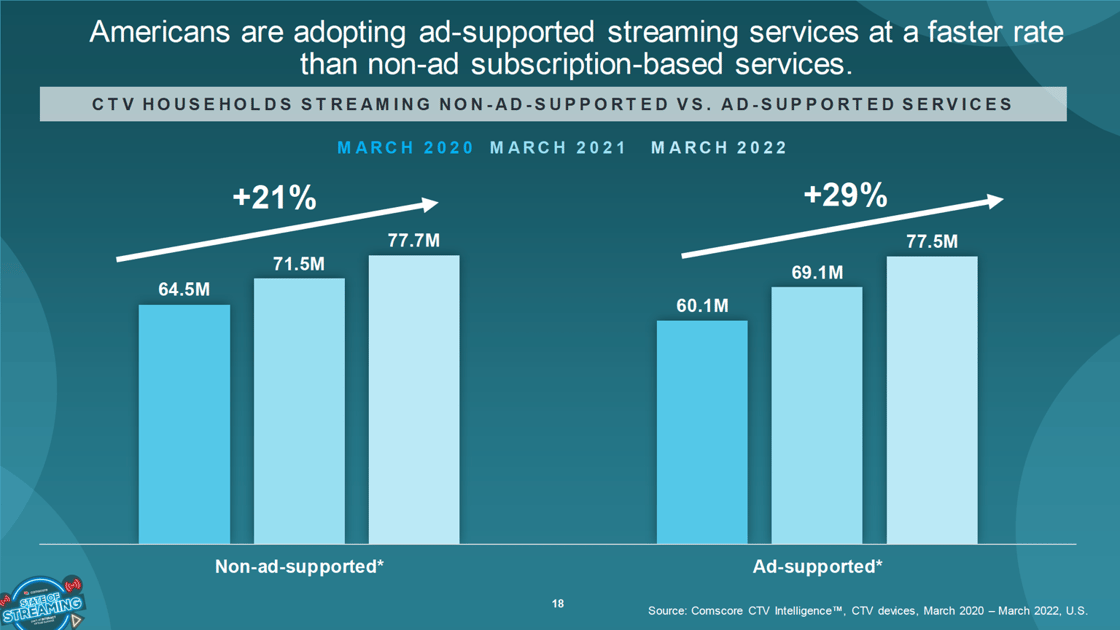
Big question #6: Are ad-free households still growing faster than ad-supported?
Quick answer: No. Ad-supported households should surpass ad-free this year.
% change in reach by revenue model:
1) Ad-supported – ↑ 29%
2) Subscription – ↑ 21%
Screen Wars Podcast: Comscore CEO Bill Livek Discusses The Renaissance of Cross-Platform Local Advertising