
Big question #1: Is streaming growing as a share of total TV time?
Quick answer: Yes. Streaming has grown its share by 23% (26% → 32%) over the past twelve months.
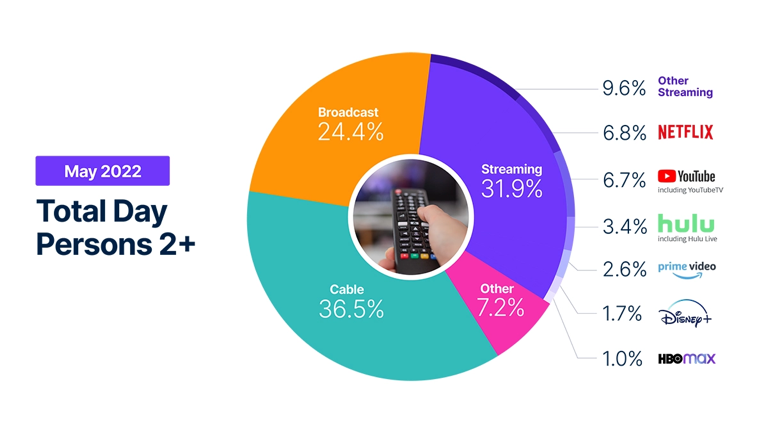
Share of total TV time according to Nielsen:
1) Cable – 37%
2) Streaming – 32%
3) Broadcast – 24%
4) Other – 7%
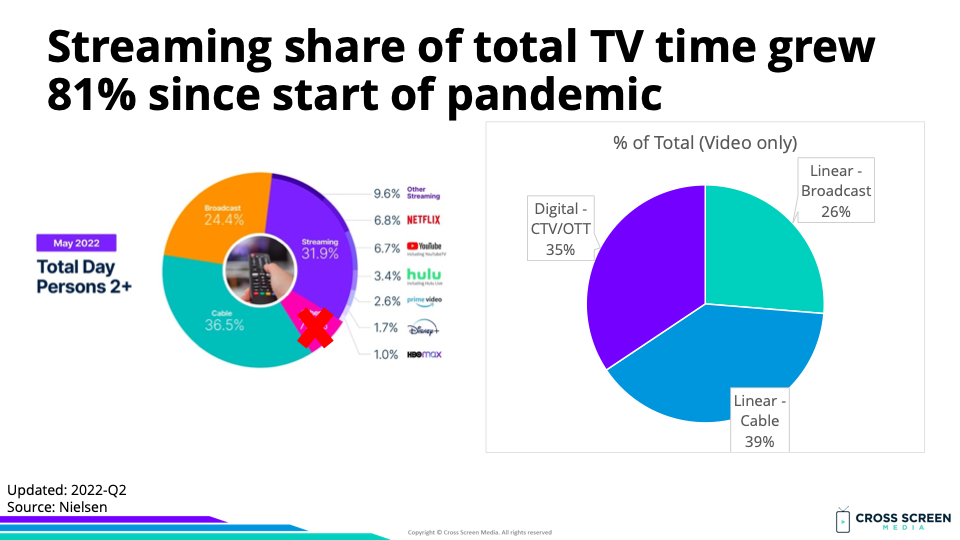
Share of total TV time (video only) according to Nielsen:
1) Cable – 39%
2) Streaming – 35%
3) Broadcast – 26%
Streaming share of total TV time (YoY growth):
1) 2019-Q4 – 19%
2) 2022-May – 34% (↑ 81%)
YoY change in total TV time:
1) Streaming – ↑ 23%
2) Cable – ↓ 6%
3) Broadcast – ↓ 20%

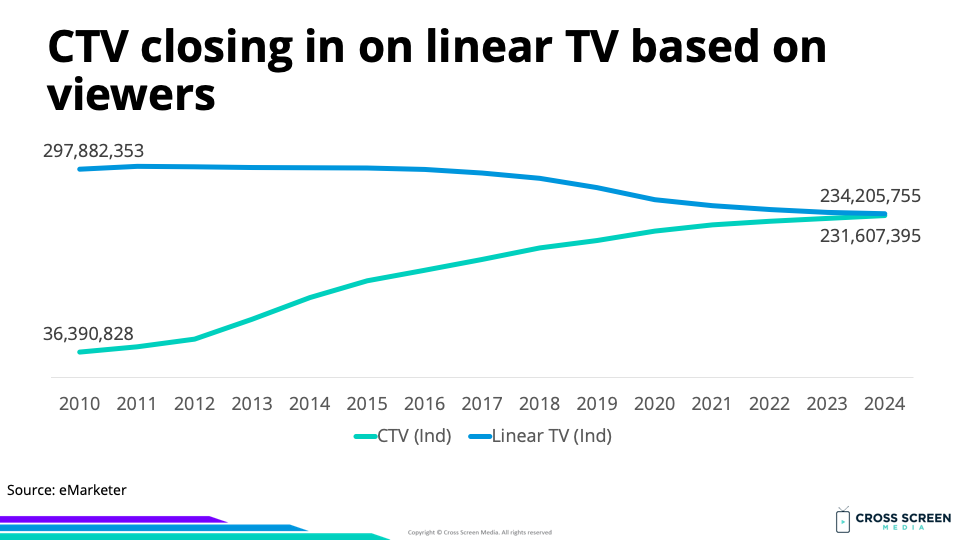
Big question #2: Are there more linear TV viewers than streaming?
Quick answer: Yes, but the gap has narrowed, and eMarketer projects parity by 2023. In 2022, there are 1.1 linear TV viewers for every one on streaming, down from 8.2 in 2010.
Ratio of linear TV to CTV viewers according to eMarketer:
1) 2015 – 2.2
2) 2016 – 1.9
3) 2017 – 1.7
4) 2018 – 1.5
5) 2019 – 1.4
6) 2020 – 1.2
7) 2021 – 1.1
8) 2022 – 1.1
9) 2023 – 1.0
10) 2024 – 1.0
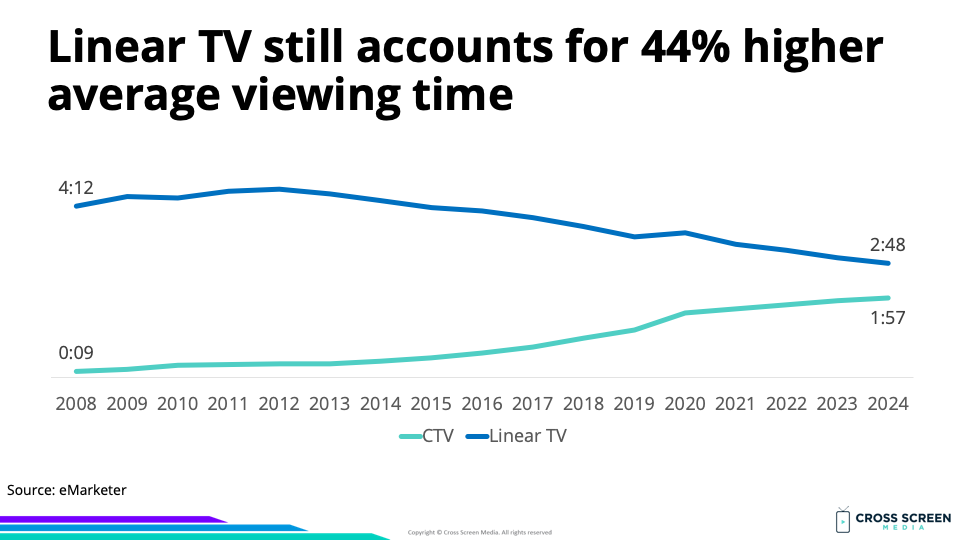
Big question #3: Is streaming at parity with linear TV for average daily viewing time?
Quick answer: No. The gap in viewing time is larger (44%) than viewers (8%).
Big question #4: Why does linear TV account for a higher share of viewing time versus total viewers?
Quick answer: Two reasons. First, the demographic that watches the most TV (65+) watches a lot of TV. Second, the demographic that watches the most CTV (<45) watches the least amount of video on a TV.

Share of broadcast/cable time by age according to Nielsen/nScreenMedia:
1) 65+ – 43%
2) 50-64 – 32%
3) 35-49 – 18%
4) 18-34 – 7%

Quote from Reid Hastings – CEO @ Netflix:
“It’s kind of obvious there’s a time frame over which streaming takes over linear. At 6 percent per year, it’s not going to be long.”
Ratio of daily hours viewed for linear TV to CTV according to eMarketer:
1) 2015 – 8.6
2) 2016 – 6.8
3) 2017 – 5.2
4) 2018 – 3.8
5) 2019 – 3.0
6) 2020 – 2.2
7) 2021 – 1.9
8) 2022 – 1.7
9) 2023 – 1.6
10) 2024 – 1.4
Big question #5: Does video ad spend line up with consumer attention?
Quick answer: No. Broadcast TV is 26% of time spent with video while generating between 58% (local) and 63% (national) of TV advertising.

Flashback: 55 Billion Reasons to Care About Local Video Ads
Big question #6: Why is allocating video ad budget between screens so hard?
Quick answer: Recently, our industry has focused on tackling measurement. Our tools have not kept pace with the fragmentation of viewing combined with the growth in audience targeting. We believe an equally important and under-appreciated problem is planning and allocation.
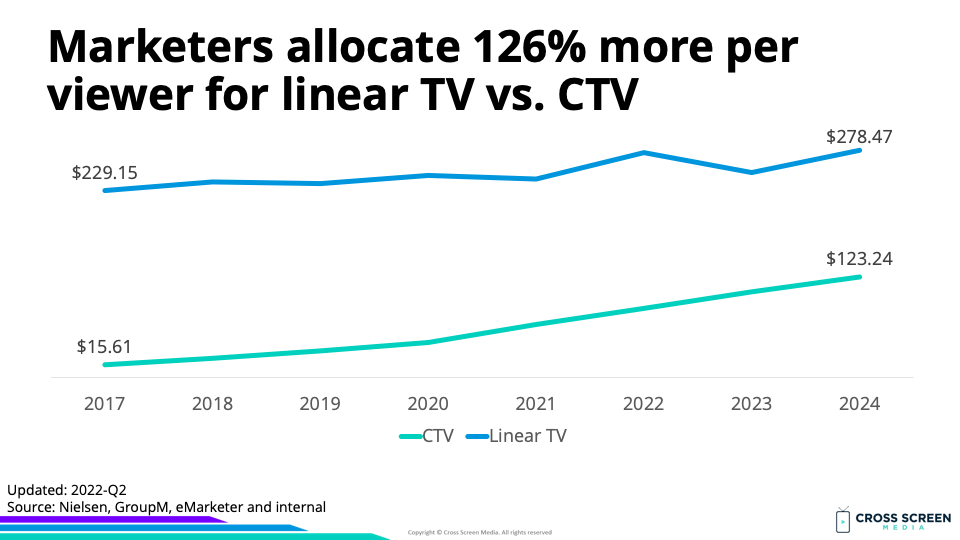
Video ad spend per viewer in 2022:
1) Linear TV – $278
2) CTV – $123
Big question #7: Are CTV ads underpriced?
Contrarian view: Yes!!! When you consider all video ad options together in a single planning environment and audience targeting, media consumption, attention and pricing, then CTV ads are underpriced. Most linear TV buyers are missing the audience targeting component. Vice versa, most digital video buyers are missing the attention and pricing component.
Video: The Gauge: Total TV & Streaming Snapsot (May 2022 Update)


