Articles
Why Local Planning Requires Local Tools
When it comes to local video advertising, many media buyers reach for what they know: the “tried and true” methods of blanketing a geographic region, or, in the case of linear TV, targeting solely by age and gender.
September 7, 2022
But as cross-screen campaigns across linear, CTV, and digital video become the norm, however, the “tried and true” is falling short.
Media consumption has shifted dramatically over the past few years and it continues to evolve quickly. Between May 2021 and May 2022, for example, streaming video grew 23% year over year, largely at the expense of linear and cable. Meanwhile, factors like geography, channel, audience characteristics and consumption variables all interact in non-intuitive ways when planning campaigns. Today’s cross-channel local advertising market requires local-specific tools. It requires the massive reach of broadcast with the precision targeting of digital advertising, across all screens, to create a unified audience profile.
We dive into a real-world example below to highlight the power, and importance, of using local-focused solutions to plan audience-driven, market-by-market campaigns.
Case Study: Local Automotive Advertising
This example looks at data from a cross-screen campaign targeting a specific audience segment: individuals in the market for a new sedan. We used Cross Screen Media’s local campaign planning tool, ScreenSolve, to work towards the single goal of maximizing our on-target reach.
Audience Profiles
Chart 1

We start our plan by examining the traditional methods of segmenting the sedan-buying audience solely by age and gender. Here, we can already see that by applying age and gender to four local audience segments, there are notable differences in reach based on the local market.
Had we just targeted males, or just targeted the “golden demo” of 18-49, our plan would have missed sizable opportunities to maximize our reach. Not only is over 50% of our audience not in the 18-49 demographic in multiple markets, the differences in other areas would have drastically reduced our overall cost effectiveness and consequently our total reach. However, age and gender alone don’t even begin to show us the complete picture.
Chart 2
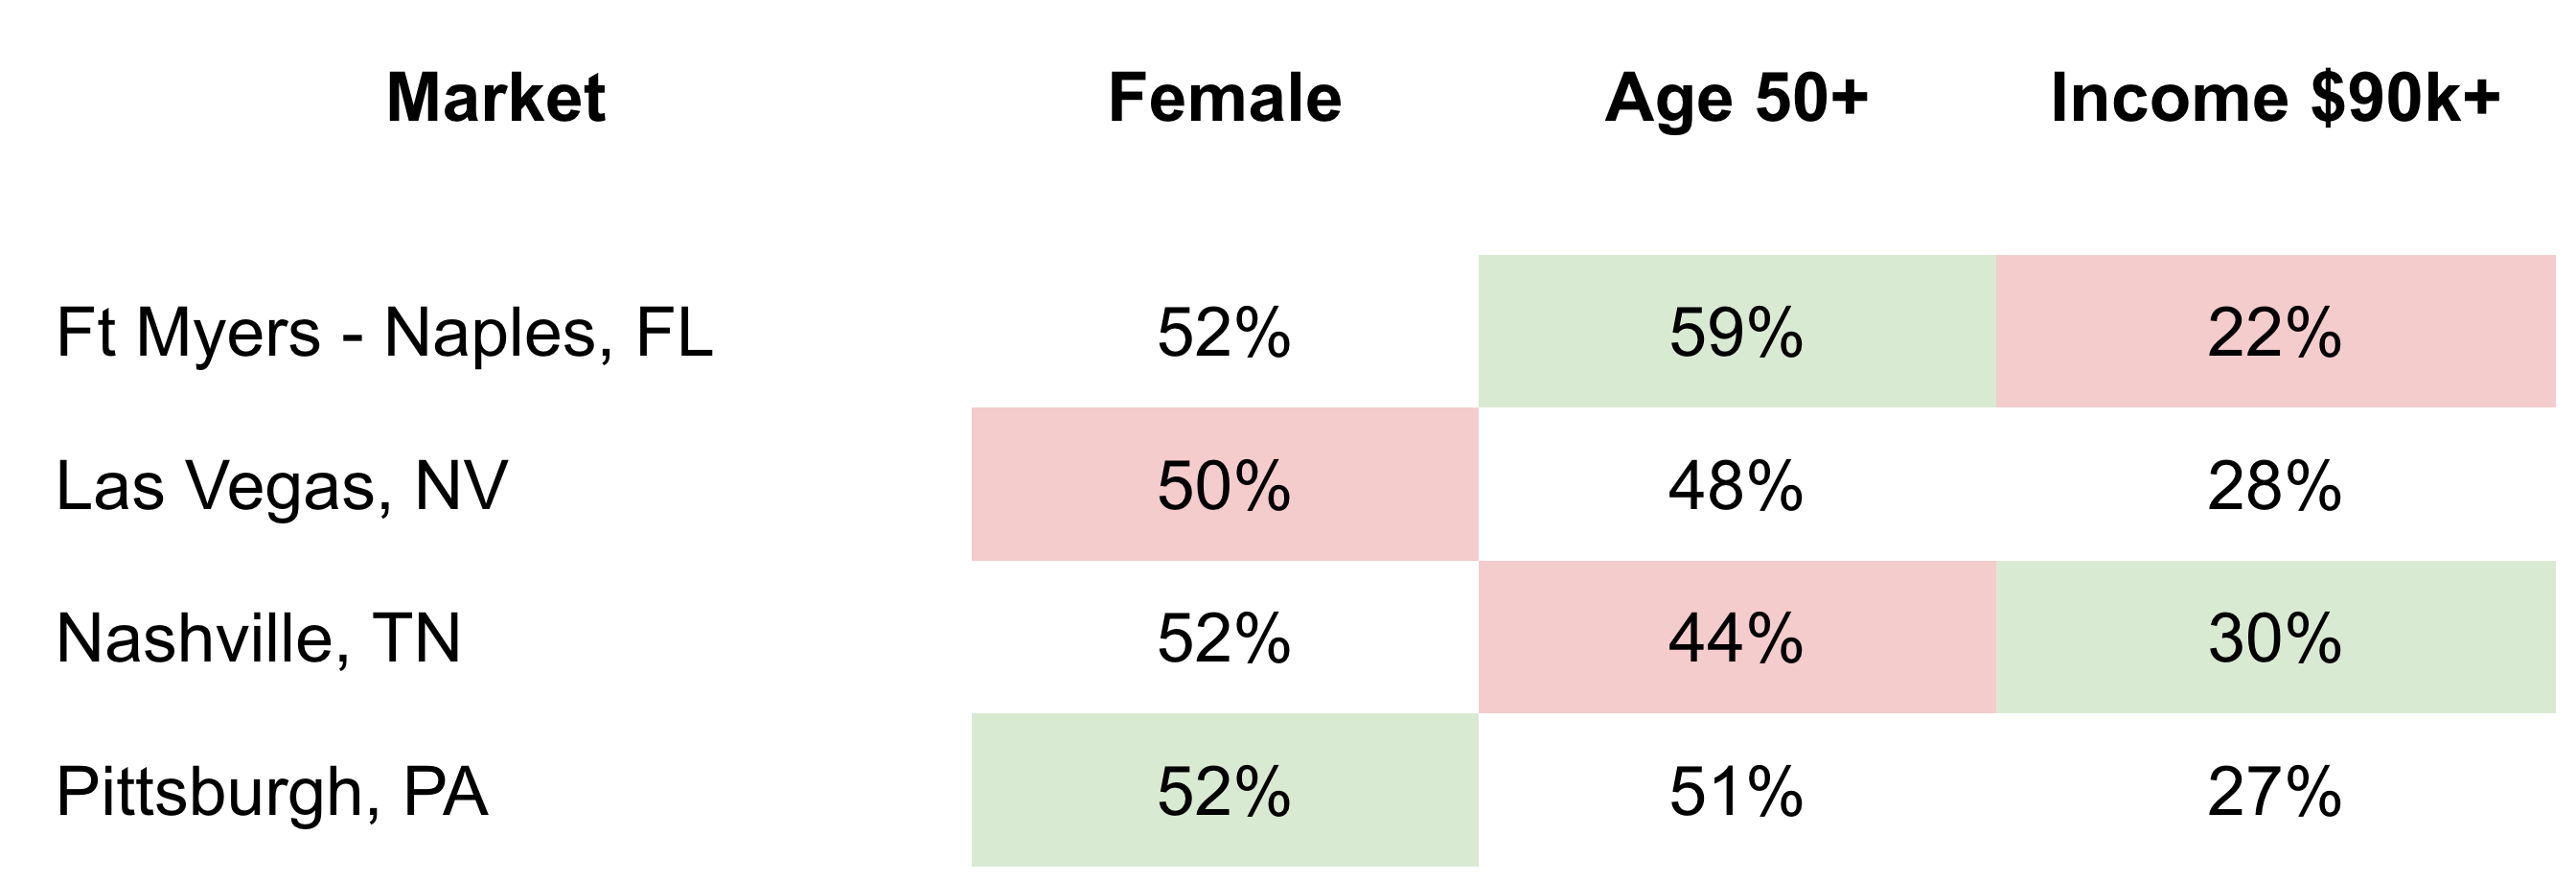
Chart 2 highlights that by adding even one additional audience dimension to our plan, income, new information about our audience emerges. Our original targeting may have overspent in Ft. Myers because it didn’t take into account that the region has among the lowest levels of high-income buyers. Likewise, areas like Nashville might have been under-represented or overlooked completely despite having some of the highest percentages of wealthy buyers within this audience segment.
Even small differences in these percentages can quickly add up to large gains in reach and reductions in costs, especially for broader campaigns that often run into the millions of dollars.
Media Consumption
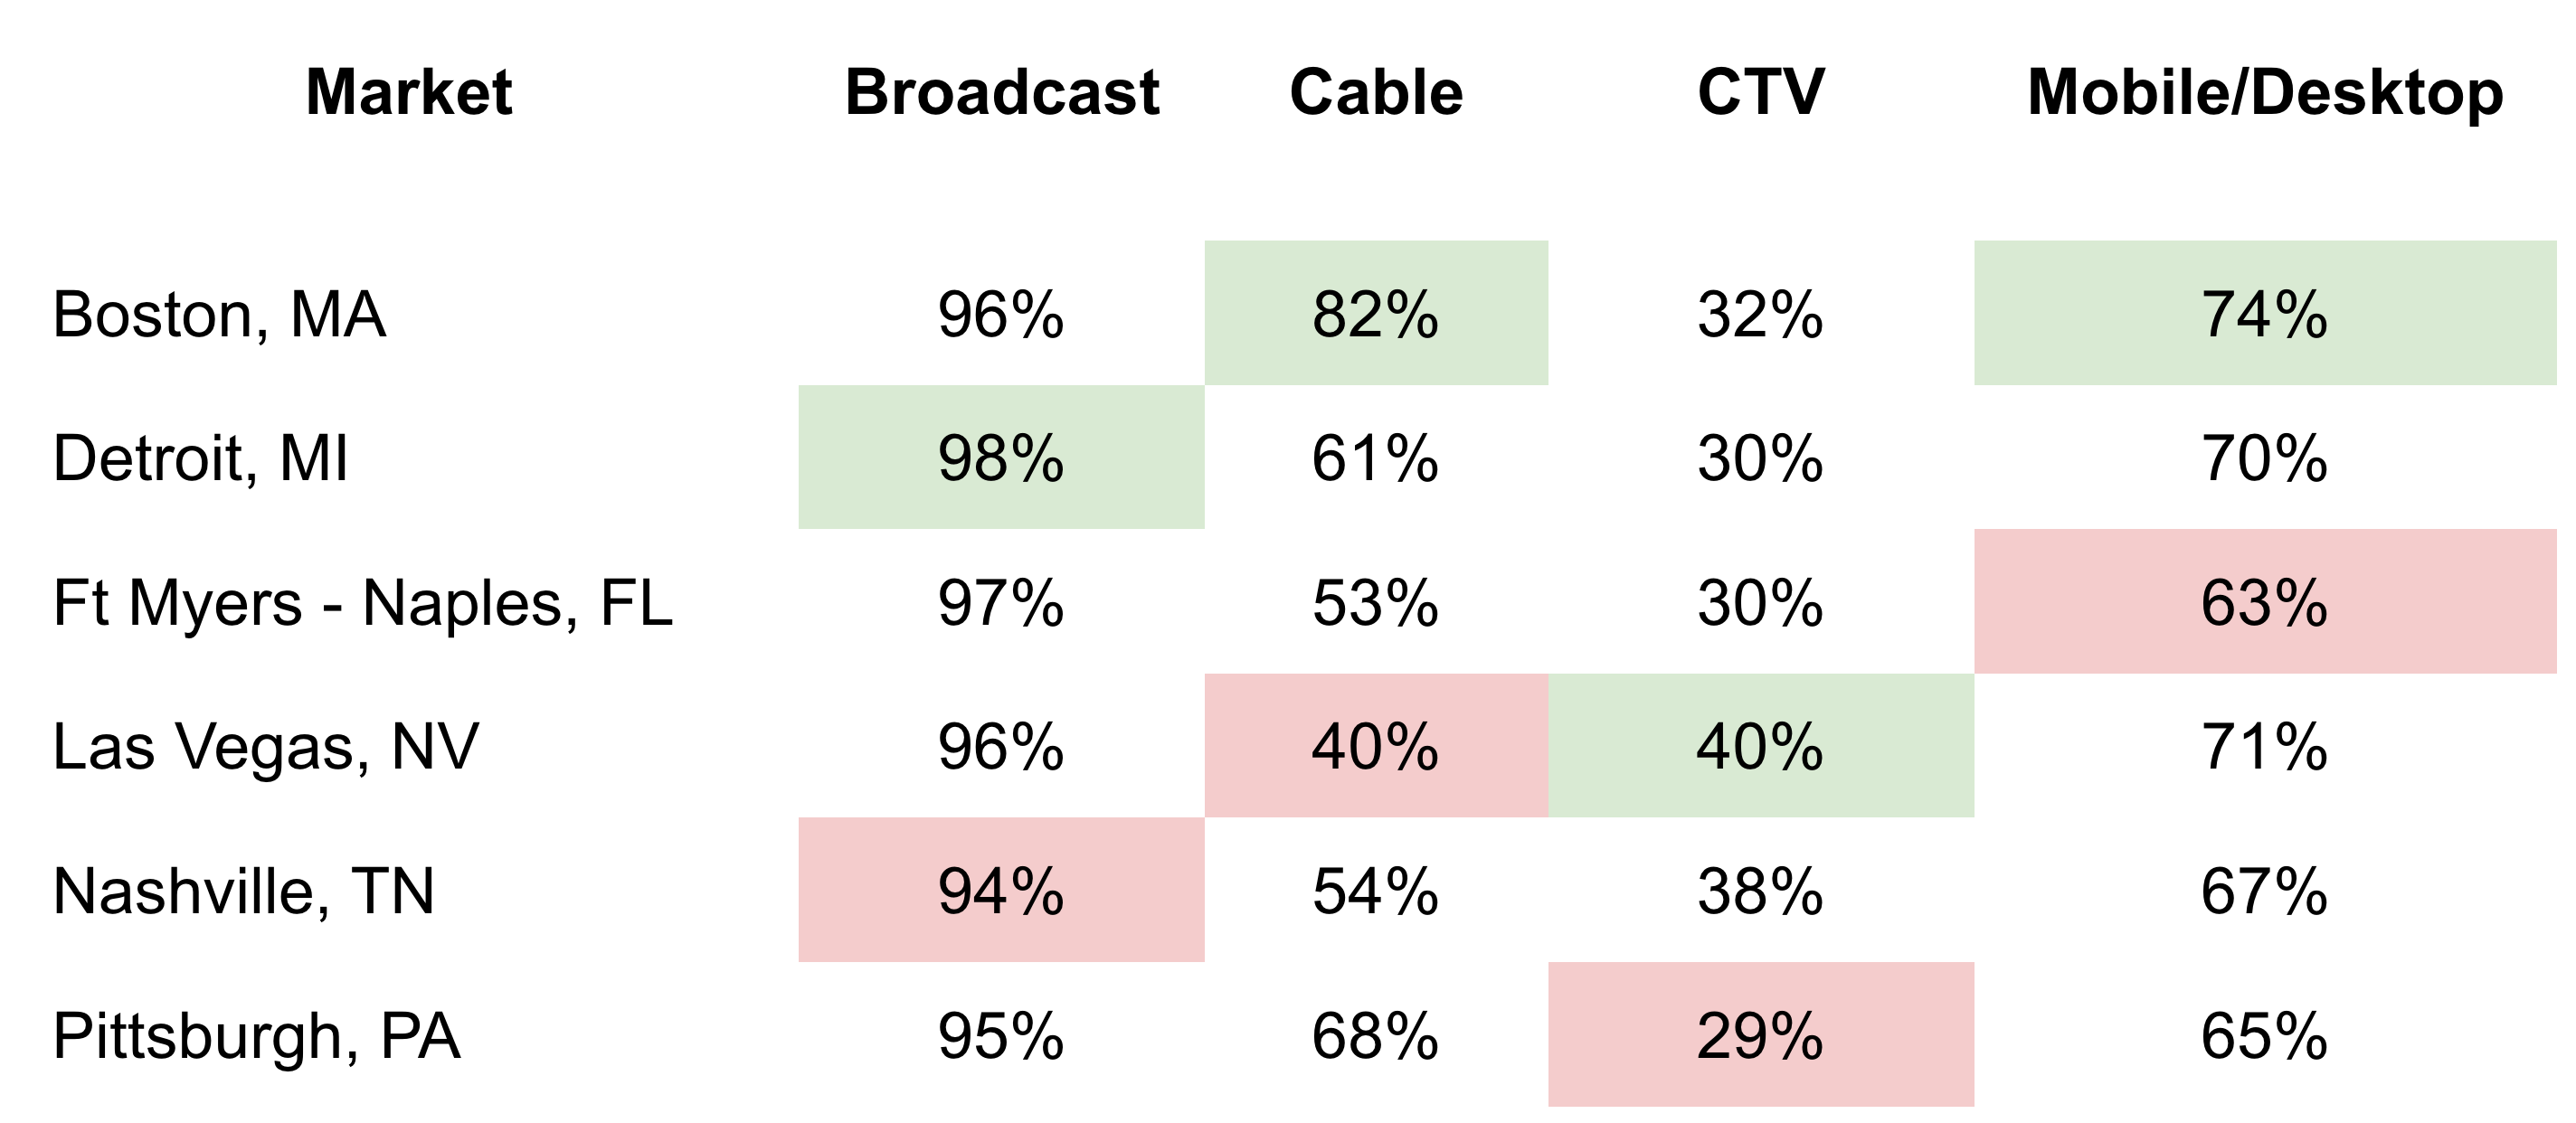
Chart 3
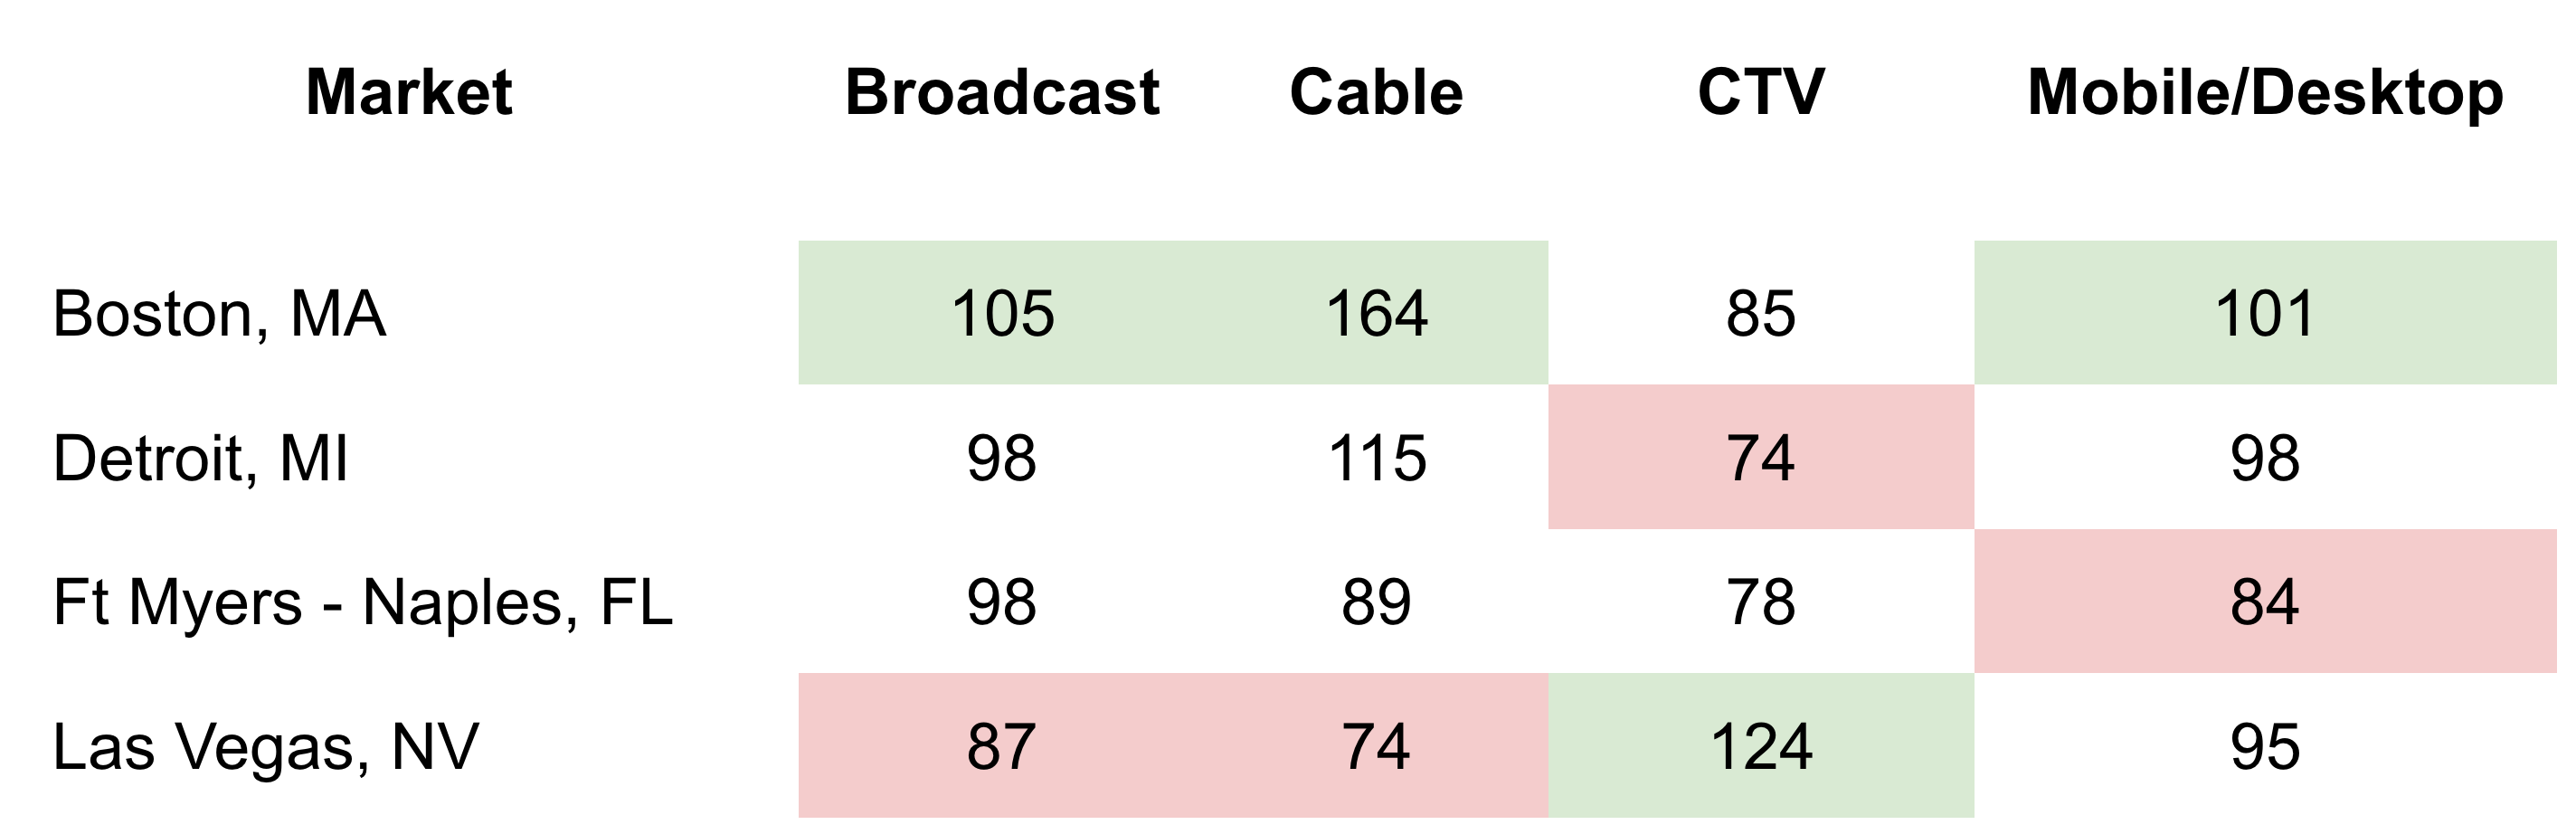
Chart 3 highlights this audience’s consumption habits by market. Using this index, numbers over 100 signify that consumption is higher than average in this market, while conversely, numbers lower than 100 signal lower than average consumption.
The digital video revolution has broadened consumption from just broadcast and cable to include Connected TV as well as video on mobile and desktop devices. Each of these channels comes with varying consumption habits, by market, by audience segment.. By allocating our spend with a holistic view, we can reduce waste and greatly increase our reach, efficiency and ultimately results.
Chart 4
We must also consider the total possible reach each channel has across markets. Meaning if an advertiser spent infinite dollars in a specific channel, what percentage of the target audience segment would see their message on that screen?
As with all of our other metrics, the overall reach can vary significantly from market to market. Broadcast, of course, still remains fairly ubiquitous, ranging from 94% to 98% penetration, but for all other channels, there are staggering differences. For example, we see that Cable’s total possible reach for sedan-intenders in Boston is twice that of Las Vegas. But while 40% in Cable is a low-water mark, Las Vegas’ 40% penetration in CTV is best in show.
Not All Impressions Are Equal
At the end of the day, advertisers aim to change consumer behaviors. They must artfully connect the right audience with the right messages using only a powerful medium and a combination of attention and frequency to get the job done. To this end, a key metric to consider when assessing audience reach is the Effective CPM, or eCPM. Not all video ads are viewed in the same way. Some ads are skippable, while others are not. Some ads are seen by our intended audience, while others are not. Paying for 1,000 impressions alone isn’t as effective as paying for 1,000 impressions that 1) were watched for a reasonable amount of time and 2) by those we intended to target.
Effective CPM (eCPM): The effective cost per 1,000 video impressions where a targeted viewer has watched for at least five seconds.
That’s what makes eCPM such a game-changing metric. eCPM combines all of these factors to truly let advertisers compare their options across geographies, channels, and audiences while accounting for reach, attention and ultimately, cost. Using local-specific tools like ScreenSolve, we can finally see the complete picture of what we’re actually getting for our ad dollars and plan accordingly.
Ad Pricing
Chart 5
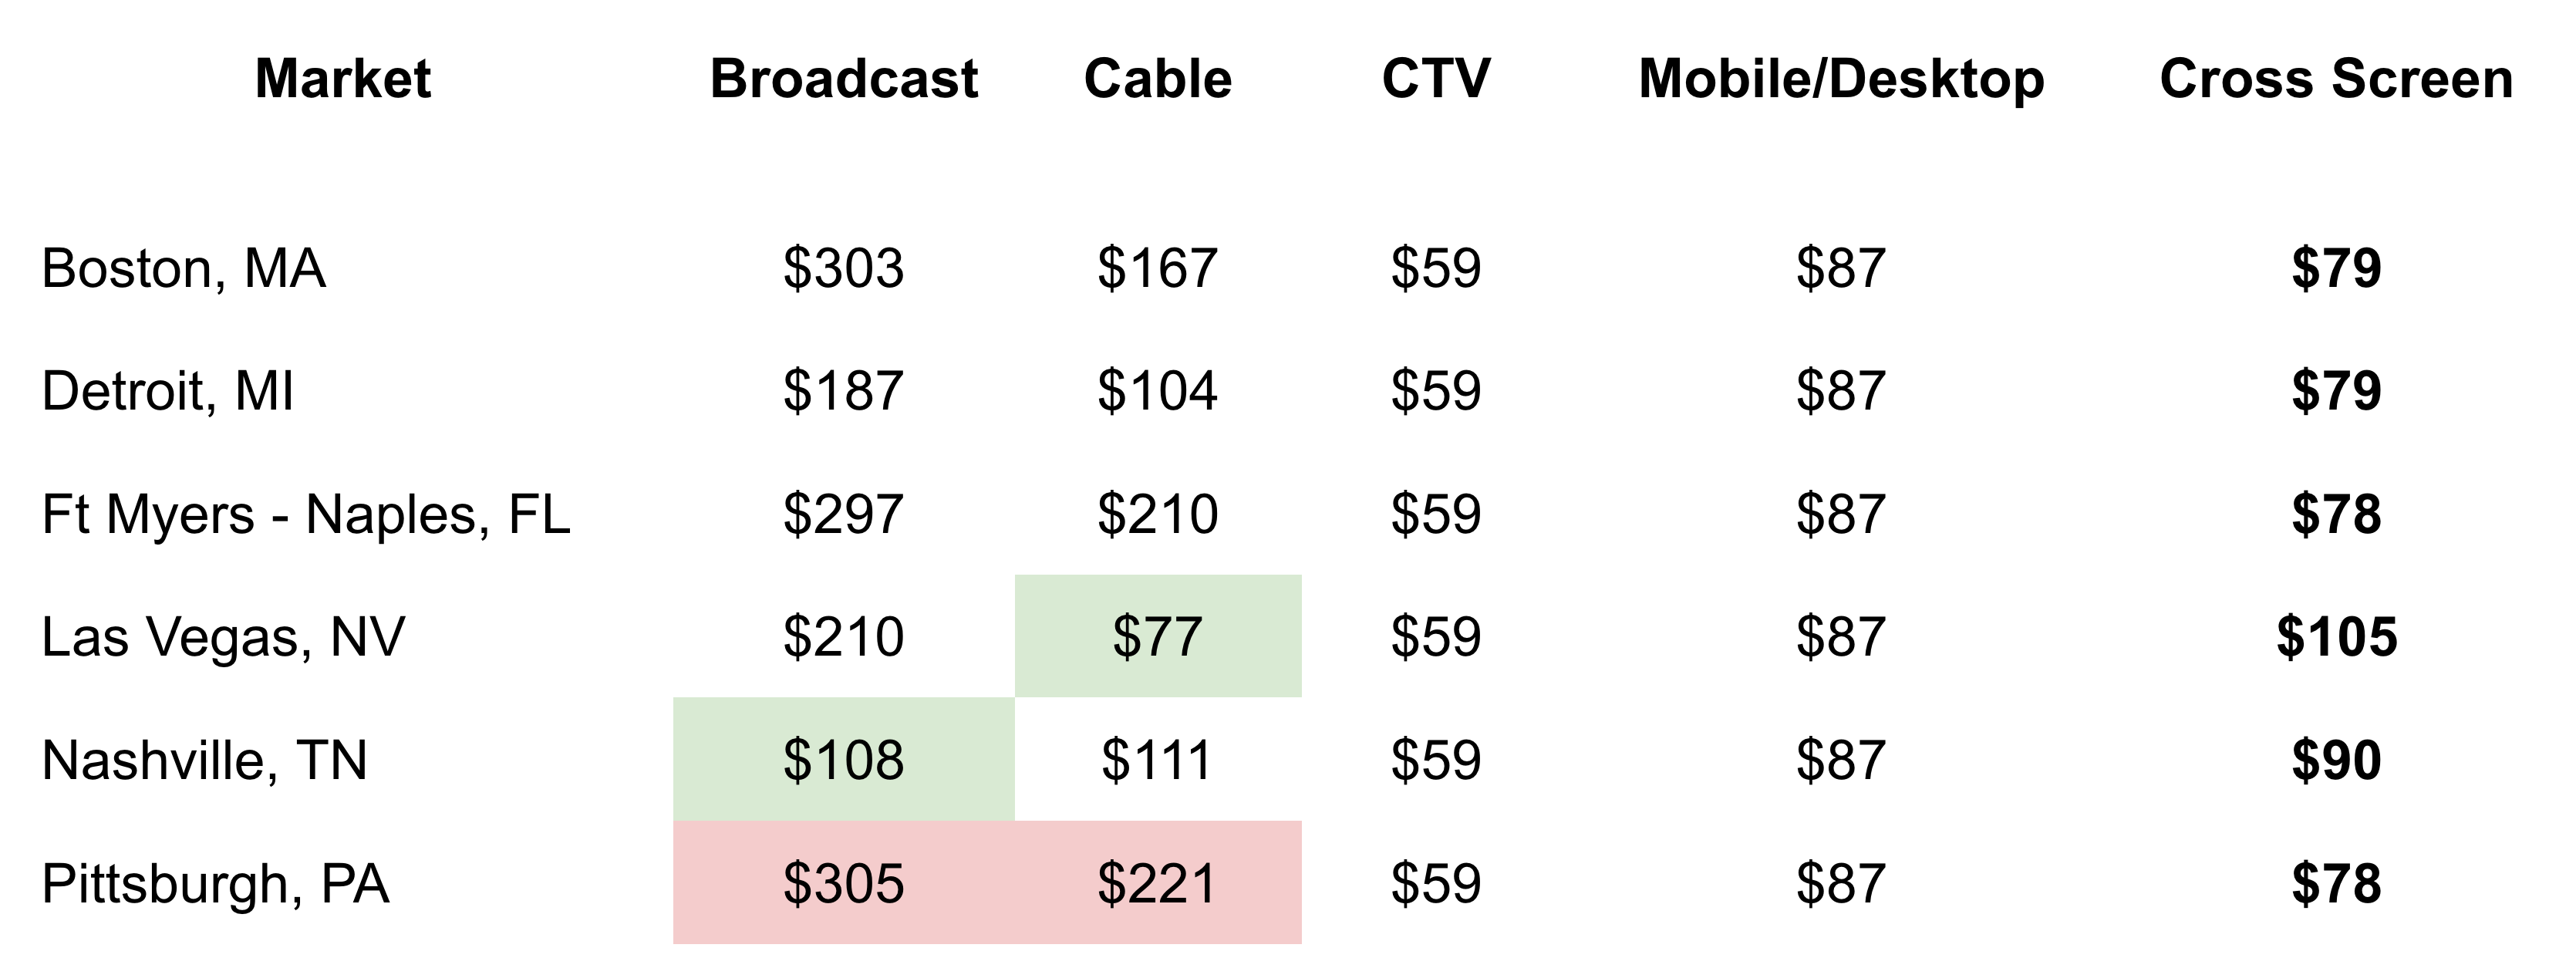
Current Average eCPM = $158
New Average eCPM = $84
This last chart shows the wide variance within each channel across markets, adding yet another level of complexity into multi-market campaign planning if you don’t have a cross-screen view that incorporates eCPMs.
This point is brought home in Chart 6, showing that by taking a granular approach and micro-targeting at the local level, we can make considerable improvements to our campaign that would have been missed with a one-size-fits-all plan. For example, had we advertised on just broadcast and cable, an advertiser would have spent eCPMs double or even triple the cost compared to a unified cross-screen local plan.
The Future Is Here…
Traditional, top-down media planning is no longer effective in today’s Convergent TV landscape. In order to plan and optimize campaigns, advertisers must plan at the local level and use tools that can target their audience at the micro level. Tools like ScreenSolve are available today, and can help media buyers to quickly plan against and measure over 60,000 audience segments.