Five big questions re: how we watch TV:
1) Is broadcast/cable gaining ground on streaming?
2) Which networks have the largest audience across linear/streaming?
3) Which streaming apps account for the highest share of total TV?
4) What share of TV households is broadband-only?
5) What do broadband-only households look like?
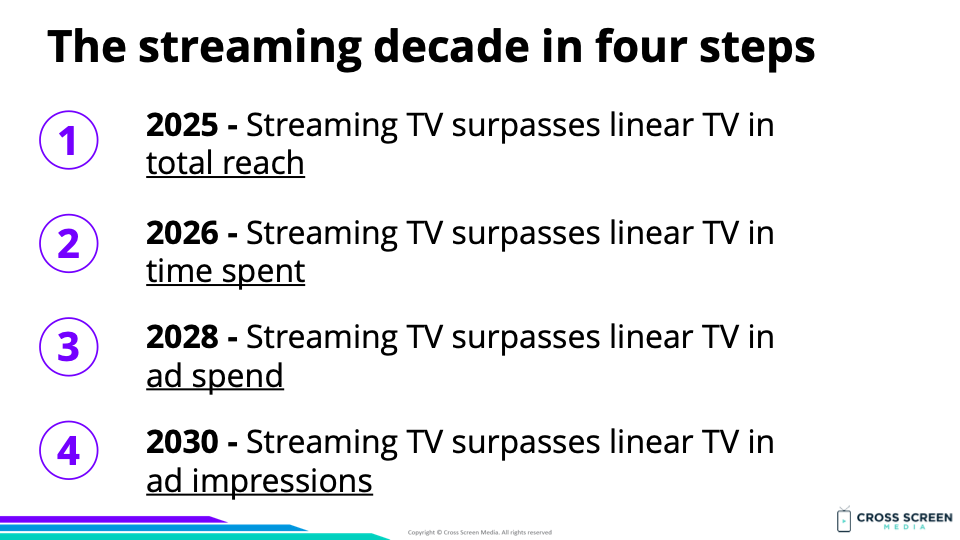
Setting the table: As we outlined in SOTS #218, the streaming decade would evolve in four steps.
The streaming decade in four steps:
1) 2025 – Streaming TV surpasses linear TV in total reach
2) 2026 – Streaming TV surpasses linear TV in time spent
3) 2028 – Streaming TV surpasses linear TV in ad spend
4) 2030 – Streaming TV surpasses linear TV in ad impressions
Why this matters: Step #2 was streaming surpassing linear TV in time spent by 2026. This may not have been aggressive enough as linear TV continues to bleed time. The July numbers from Nielsen show linear losing 6% of their share YoY. By mid-2024, streaming could overtake linear TV if the next 12 months are similar.
Flashback: The streaming decade in four steps
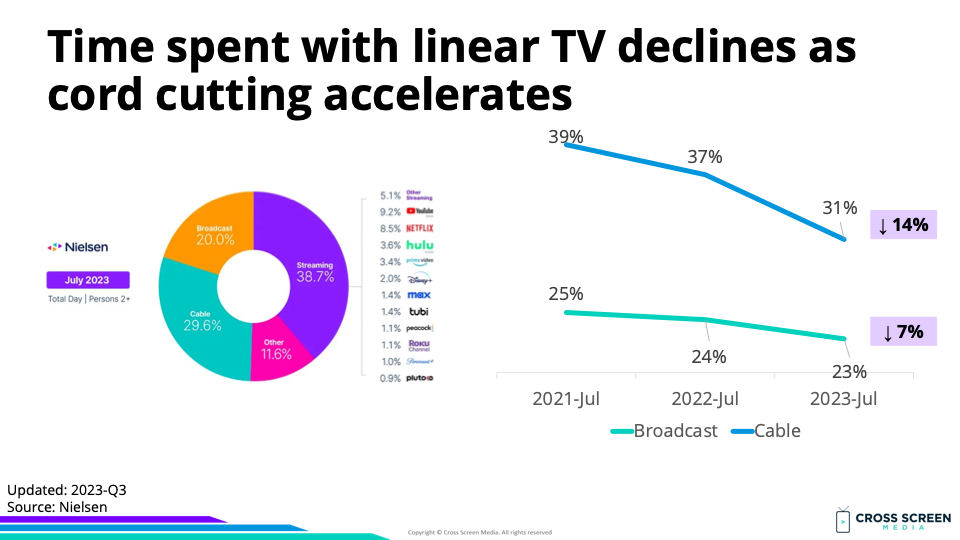
Big question #1: Is broadcast/cable gaining ground on streaming?
Quick answer: No. Time spent with linear TV declined 11% over the past year.
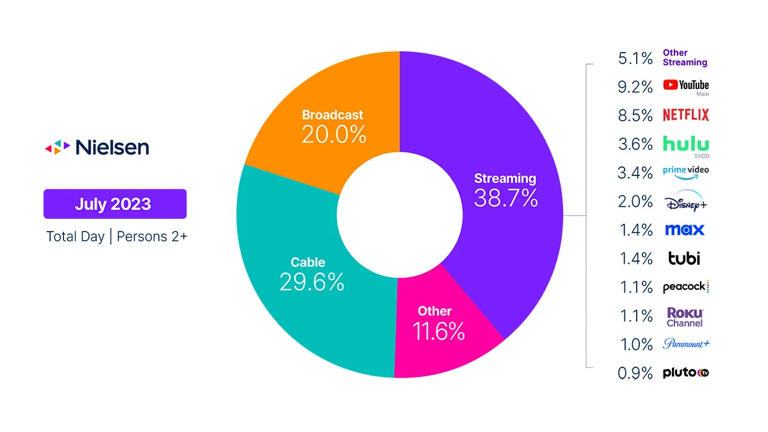
Share of total TV time according to Nielsen:
1) Streaming – 39%
2) Cable – 30%
3) Broadcast – 20%
4) Other – 12%
Big question #2: Which networks have the largest audience across linear/streaming?
Total day average viewership for June 2023 according to TV Grim Reaper:
1) YouTube (no live TV) – 4.8M
2) Netflix – 4.5M
3) ABC – 2.5M
4) CBS – 2.1M
5) Hulu (no live TV) – 2.0M
6) NBC – 1.8M
7) Amazon Prime – 1.8M
8) Fox – 1.5M
9) Disney+ – 1.1M
10) Fox News – 1.1M
Why this matters: Netflix and YouTube dominate the streaming market in Nielsen’s Gauge report, but it is interesting that both networks nearly double the top broadcast network (ABC). Also, Disney+ is the #5 streaming service but is already at par with the #1 cable network (Fox News).
Big question #3: Which streaming apps account for the highest share of total TV?
Share of total TV time (streaming only):
1) YouTube – 9%
2) Netflix – 9%
3) Hulu – 4%
4) Amazon Prime – 3%
5) Disney+ – 2%
6) Tubi – 1%
7) HBO Max – 1%
8) Peacock – 1%
9) Roku Channel – 1%
10) Paramount+ – 1%
11) PlutoTV – 1%
12) Other – 5%
Big question #4: What share of TV households is broadband-only?
Quick answer: 38%
Share of households that are broadband-only, according to Nielsen:
1) 2015 – 3%
2) 2016 – 3%
3) 2017 – 5%
4) 2018 – 8%
5) 2019 – 12%
6) 2020 – 15%
7) 2021 – 20%
8) 2022 – 31%
9) 2023 – 38%

Wow: The share of broadband-only homes grew 56% (20% → 31%) in a year (2021 → 2022)!
Big question #5: What do broadband-only households look like?
Quick answer: Broadband-only households are younger (37) with children (42%) and higher income ($69K).


