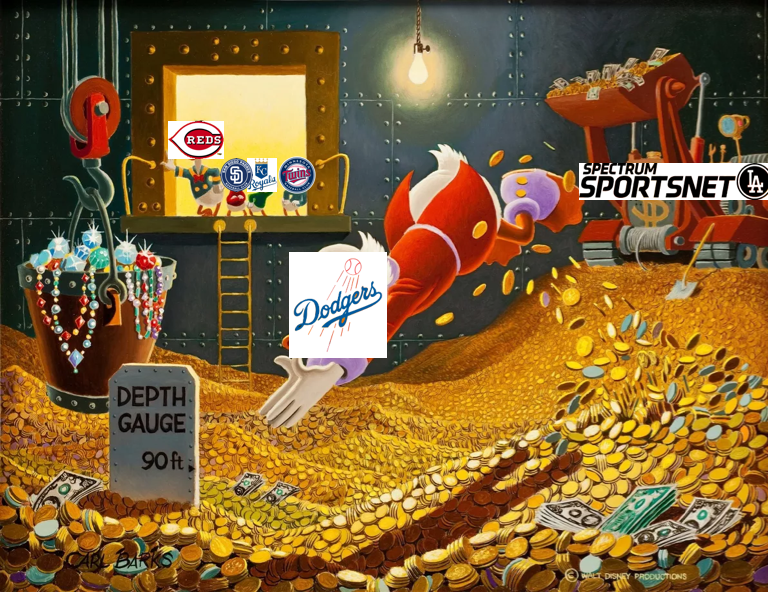
Eight big questions re: baseball + local TV:
1) How large is the average Major League Baseball team’s payroll?
2) Why are some teams aggressively adding payroll while others are scaling back?
3) How does Major League Baseball make money?
4) What share of revenue comes from local TV?
5) Have regional sports networks (RSN) solved their major problems?
6) How many pay-TV subscribers regularly watch an RSN?
7) How long is the average Major League Baseball game?
8) Did shorter games bring more fans to the game?
Setting the table: The Los Angeles Dodgers stunned the baseball world by adding $1.2B in salary commitments to just 3 players.
Key offseason additions for the Los Angeles Dodgers:
1) Shohei Ohtani – $700M over 10 years
2) Yoshinobu Yamamoto – $325M over 12 years
3) Tyler Glasnow – $135M over 5 years
4) Total – $1.2B
Why this is stunning: The Dodgers can do this at a time when half of the teams’ primary revenue stream (local TV) is at risk.
Flashback #1: Local TV and the Changing Economics of Baseball
Flashback #2: Will the MLB Lockout Dampen Advertiser Enthusiasm?
Big question #1: How large is the average Major League Baseball team’s payroll?
Average MLB total payroll (YoY growth) according to Forbes/Spotrac:
1) 2015 – $130M (↑ 7%)
2) 2016 – $136M (↑ 5%)
3) 2017 – $142M (↑ 4%)
4) 2018 – $152M (↑ 7%)
5) 2019 – $141M (↓ 7%)
6) 2020 – $58M (↓ 59%)
7) 2021 – $135M (↑ 132%)
8) 2022 – $150M (↑ 11%)
9) 2023 – $166M (↑ 10%)
10) 2024 – $153M (↓ 8%)
Big question #2: Why are some teams aggressively adding payroll while others are scaling back?
Quick answer: Not only does a team like the Dodgers benefit from the highest annual rights revenue for local TV, but they also have clarity through 2039 as a part of the 25-year deal they signed with Charter Communications in 2014. Most other teams are concerned that their much smaller deals may not exist after this season.
Bottom line: Charter Communications guarantees the Dodgers $8.35B over 25 years ($334M/year).
MLB teams with the highest annual rights fees for local TV, according to Forbes:
1) Los Angeles Dodgers – $196M
2) New York Yankees – $143M
3) Philadelphia Phillies – $125M
4) Los Angeles Angels – $112M
5) Texas Rangers – $111M
MLB teams with the lowest annual rights fees for local TV:
1) Minnesota Twins – $42M
2) Kansas City Royals – $45M
3) San Diego Padres – $47M
4) Cincinnati Reds – $48M
5) Miami Marlins – $49M

Big question #3: How does Major League Baseball make money?
Source of revenue (% of total) for Major League Baseball (MLB) according to Sportico:
1) Ticket sales – $3.4B (31%)
2) National revenue – $2.8B (26%)
3) Local media – $2.5B (23%)
4) Team sponsorships – $1.2B (11%)
5) Concessions/Parking/Other – $1.0B (9%)
Big question #4: What share of revenue comes from local TV?
Share of revenue from local TV according to Sportico:
1) MLB – 23%
2) NBA – 13%
3) NHL – 12%
4) NFL – 1%

Why this matters: 85% of local media comes from regional sports networks (RSNs), which are entering year two of being a total mess.
Big question #5: Have regional sports networks (RSN) solved their major problems?
Quick answer: No. Last year, Diamond Sports (Bally Sports Networks) filed for bankruptcy and walked away from distribution deals for two separate teams (Padres and Diamondbacks). Using a combination of local TV and MLB.tv, Major League Baseball kept both teams on air.
Quote from John Ourand – Sports Correspondent @ Puck News:
“Where does one even begin with the saga of Diamond Sports, the country’s largest and most troubled owner of regional sports networks? Does one start at the original sin, when Bob Iger was forced by antitrust laws to flip a portfolio of Fox Sports networks to Sinclair for about $10.5 billion, including a noose of $8 billion in debt, as an addendum to Disney’s (retrospectively questionable) $70 billion-plus consummation of the tastier Murdoch assets? Or does one begin with the wholesale collapse of the linear TV bundle and (retrospectively unwise) decision made by Fox Sports executives years ago to spend $100 million annually on local broadcast rights for teams like the Texas Rangers, or $60 million per year to air the always under-delivering and themselves debt-strapped San Diego Padres?
Or does one fast-forward to Diamond’s failure to make a $140 million interest payment last year, which plunged the company into bankruptcy? Or Amazon’s $115 million investment, contingent upon a restructuring, to be Diamond’s exclusive streaming partner? Look, I’ll save everyone the unmitigated hell and begin by telling you the good news, which you likely already know: Diamond’s recently structured $450 million debtor-in-possession financing plan, including the Amazon rescue investment, was formally approved by the bankruptcy judge this week. The company will use the cash to pay down its debts and begin operationalizing. Hooray…?”
Wow: MLB is ready to handle local media distribution for up to 16 teams in 2024
Quote from Hannah Keyser – Senior MLB Reporter @ Yahoo News:
“MLB had seen the writing on the wall for years — dating back to when Sinclair purchased the slate of RSNs from Fox in 2019 — and had been preparing since late 2022 for the possibility that DSG would not be able to fulfill its contracts in 2023. That involved building out a local media department, which was pressed into action first in late May and then in mid-July to take over broadcasts for the Padres and Diamondbacks. For the remainder of the season, those teams’ games were available on linear cable television in their home markets as well as direct-to-consumer via MLB.tv in the same market at $19.99 per month or $74.99 for the remaining Padres games and $54.99 for the remaining D-backs games.”
Big question #6: How many pay-TV subscribers regularly watch an RSN?
Quick answer: ≈ 10-15% of pay-TV subscribers regularly watch their local RSN.
Big question #7: How long is the average Major League Baseball game?
Average length of MLB game (YoY growth) according to Baseball Reference:
1) 2022 – 3h 10m
2) 2023 – 2h 39m (↓ 16%)

Big question #8: Did shorter games bring more fans to the game?
MLB total attendance (YoY growth):
1) 2022 – 64.6M
2) 2023 – 70.8M (↑ 10%)


