Four big questions re: how we watch video:
1) What share of our leisure time is spent watching TV?
2) Is streaming growing as a share of total TV time?
3) What content do viewers default to first?
4) What impact is fragmentation having on ratings/viewership?
Flashback: Nielsen Gauge: Streaming Takes Over Top Spot
Big question #1: What share of our leisure time is spent watching TV?
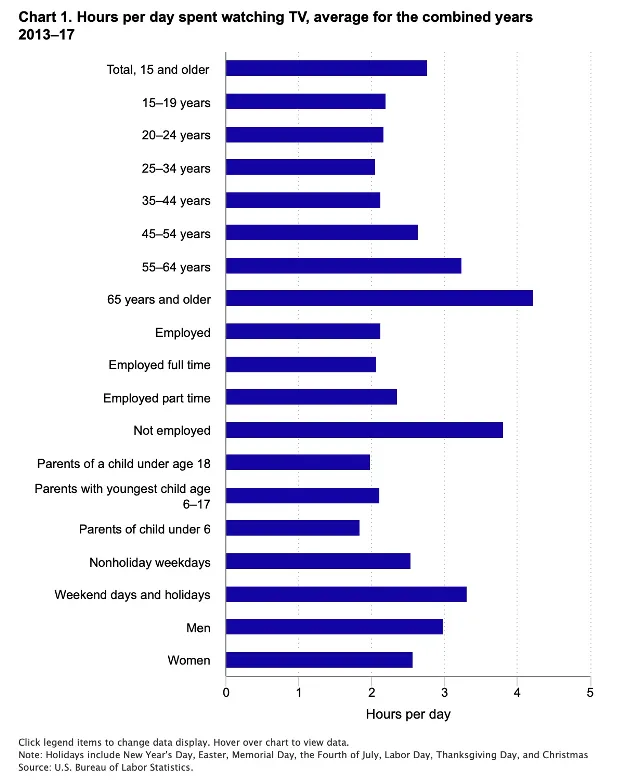
Quick answer: According to the U.S. Bureau of Labor Statistics, Americans spend 55% of their leisure time watching TV.
Worth your time: Entertainment Strategy Guy released a five-part series breaking down The American Viewer.
Big question #2: Is streaming growing as a share of total TV time?
Quick answer: Yes.
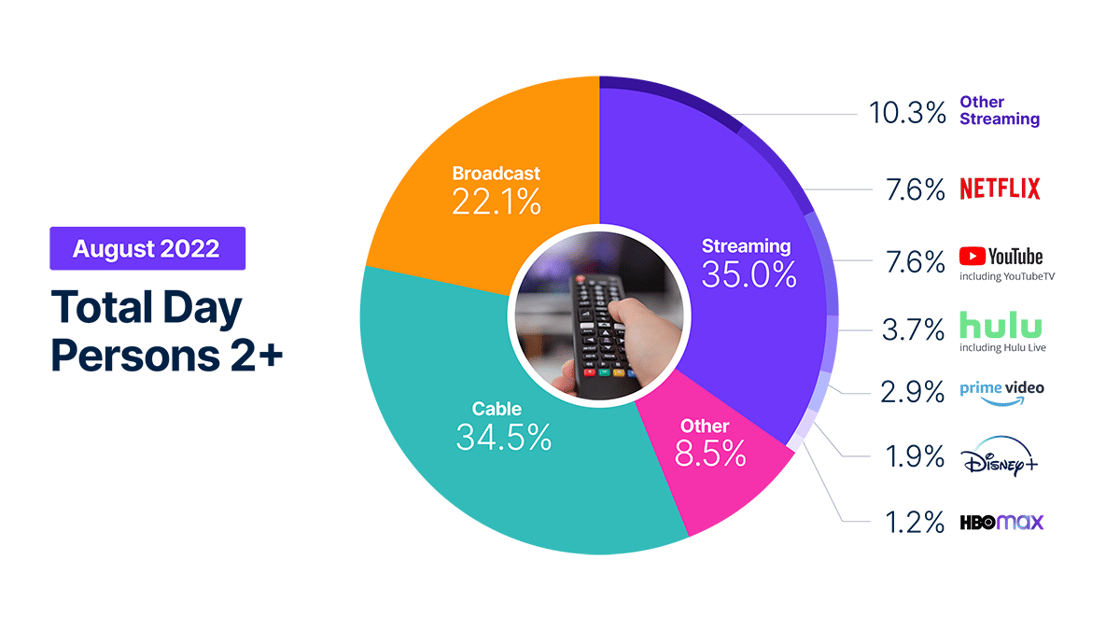
Share of total TV time according to Nielsen:
1) Streaming – 35%
2) Cable – 35%
3) Broadcast – 22%
4) Other – 8%
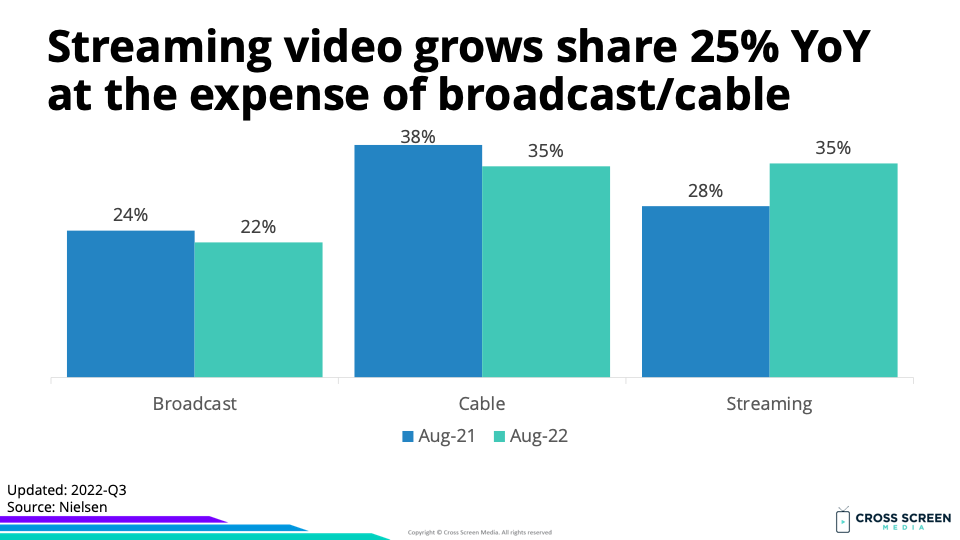
Share of total TV time (video only) according to Nielsen:
1) Streaming – 38%
2) Cable – 38%
3) Broadcast – 24%
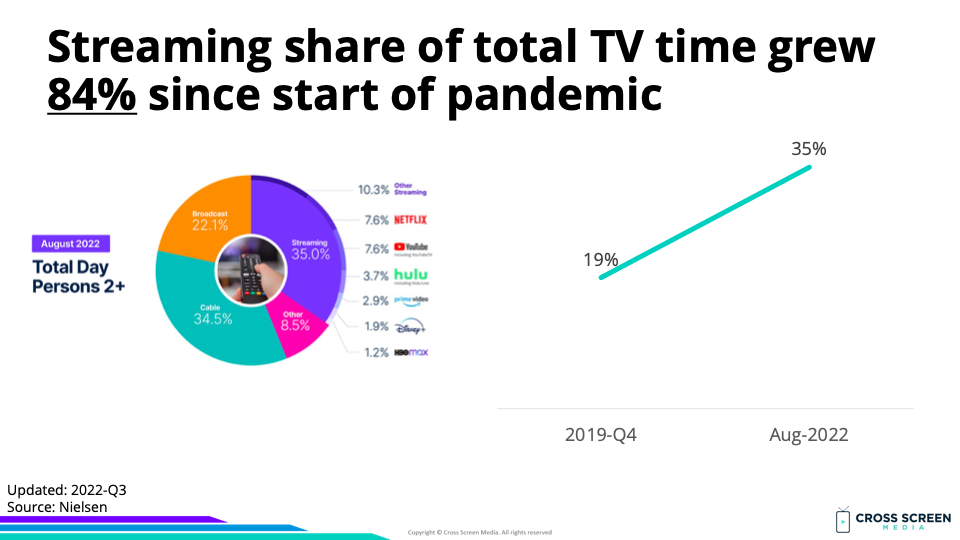
Streaming share of total TV time (YoY growth):
1) 2019-Q4 – 19%
2) 2022-Aug – 35% (↑ 84%)
YoY change in total TV time:
1) Streaming – ↑ 25%
2) Broadcast – ↓ 8%
3) Cable – ↓ 9%
YoY growth rate for streaming:
1) May – ↑ 23%
2) June – ↑ 25%
3) July – ↑ 24%
3) August – ↑ 25%
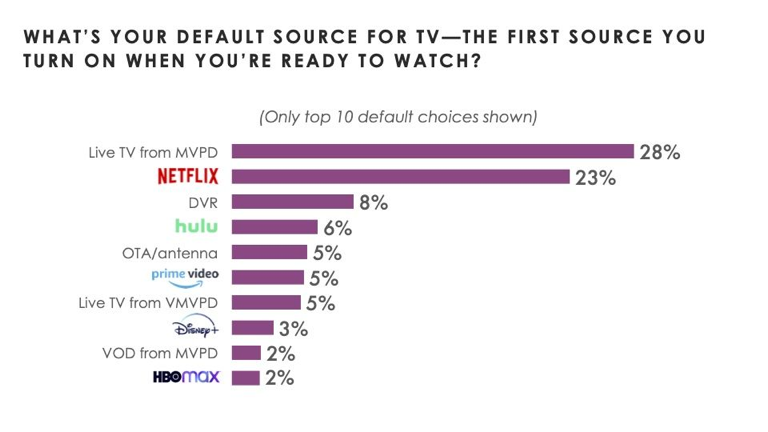
Big question #3: What content do viewers default to first?
First source for watching TV according to Hub Entertainment Research:
1) Live TV (through pay-TV) – 41%
2) Netflix – 23%
3) Hulu – 6%
4) OTA/Antenna – 5%
5) Amazon Prime Video – 5%
Big question #4: What impact is fragmentation having on ratings/viewership?
Quick answer: Non-sports viewership for broadcast networks has dropped 33% over the past 5 years.
Quote from Bob Iger – Formers Chairman and CEO @ Disney:
Traditional TV is “marching to a great precipice, and it will be pushed off.”
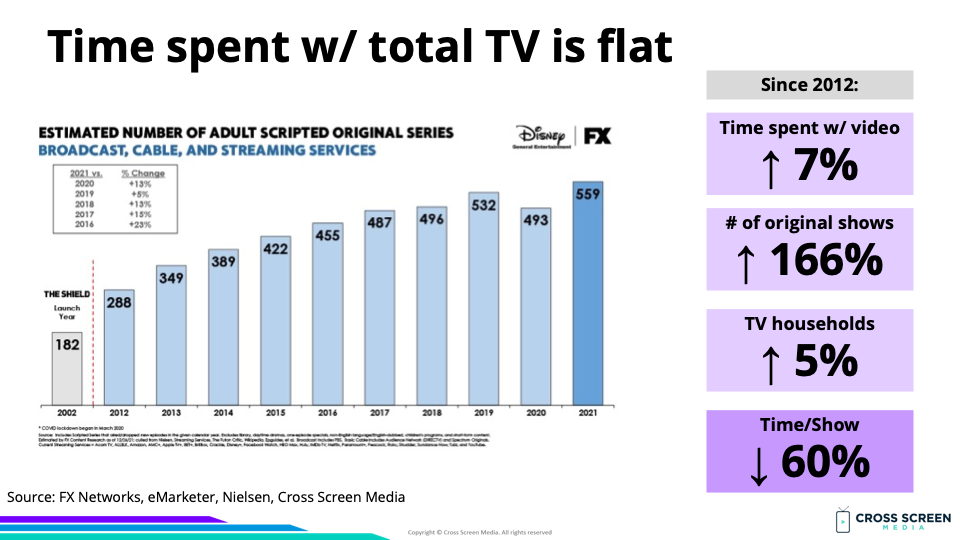
Quick math for change in attention available for the average show since 2012:
1) Time spent w/ video – ↑ 7%
2) # of original shows – ↑ 166%
3) TV households – ↑ 5%
4) Average time/show – ↓ 60%
Quote from Michael Thorn – President of Entertainment @ Fox:
“If you look at the biggest streamers, collectively they launched more than 2,000 series, and of those, approximately 15% were seen by a million people.”

