Four big questions re: how we watch video:
1) How much video do we watch every day?
2) Is streaming growing as a share of total TV time?
3) Are all demographic groups watching less linear TV?
4) What happens to average TV ad frequency with a growing number of zero/low TV households?
Big question #1: How much video do we watch every day?
Quick answer: 5+ hours
Average daily video time (YoY growth) according to Activate Consulting:
1) 2019 – 5h 8m
2) 2020 – 5h 28m (↑ 6%)
3) 2021 – 5h 21m (↓ 2%)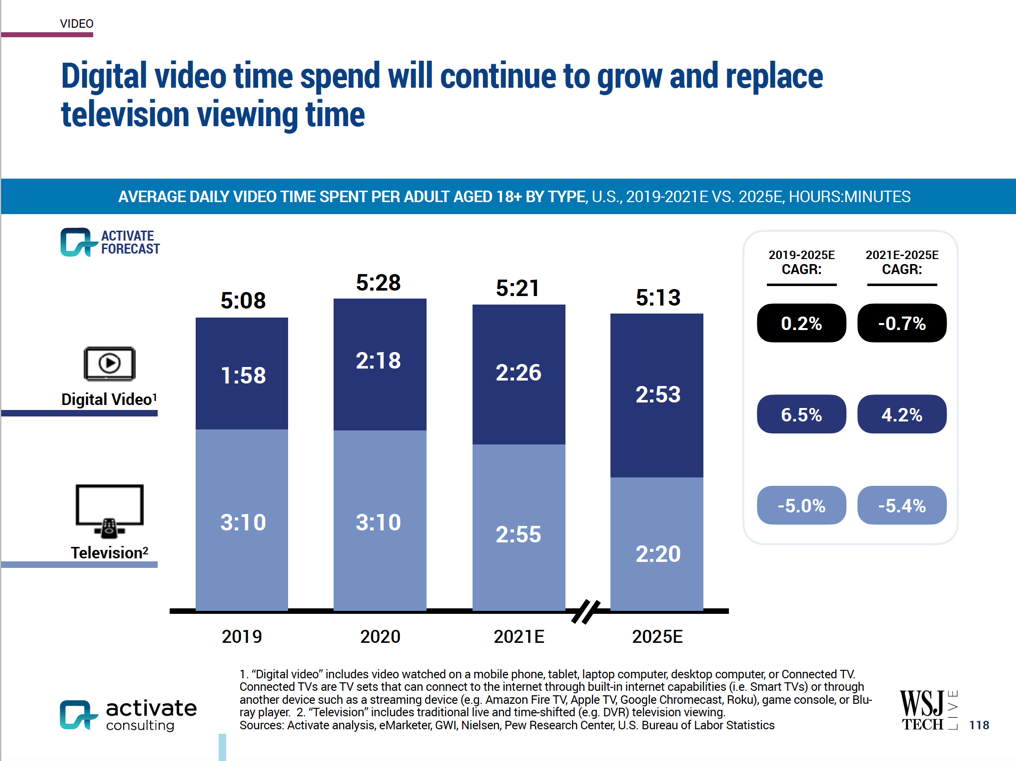
Why this matters: The total time we spend with video is not growing. The fight for attention/share between linear TV and streaming is a zero-sum game.
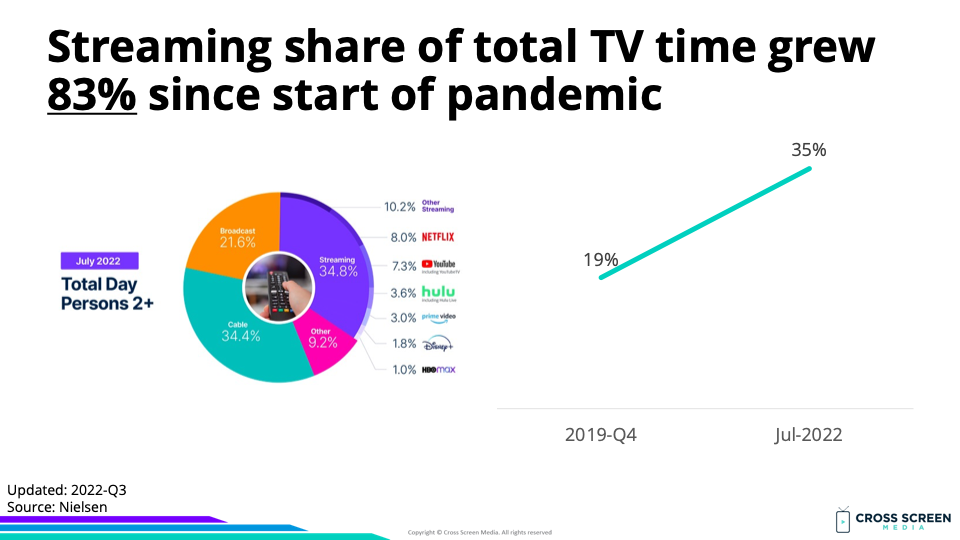
Big question #2: Is streaming growing as a share of total TV time?
Quick answer: Yes. Streaming has grown its share by 24% (28% → 35%) over the past twelve months. For the first time in July, streaming was more popular than broadcast or cable TV.
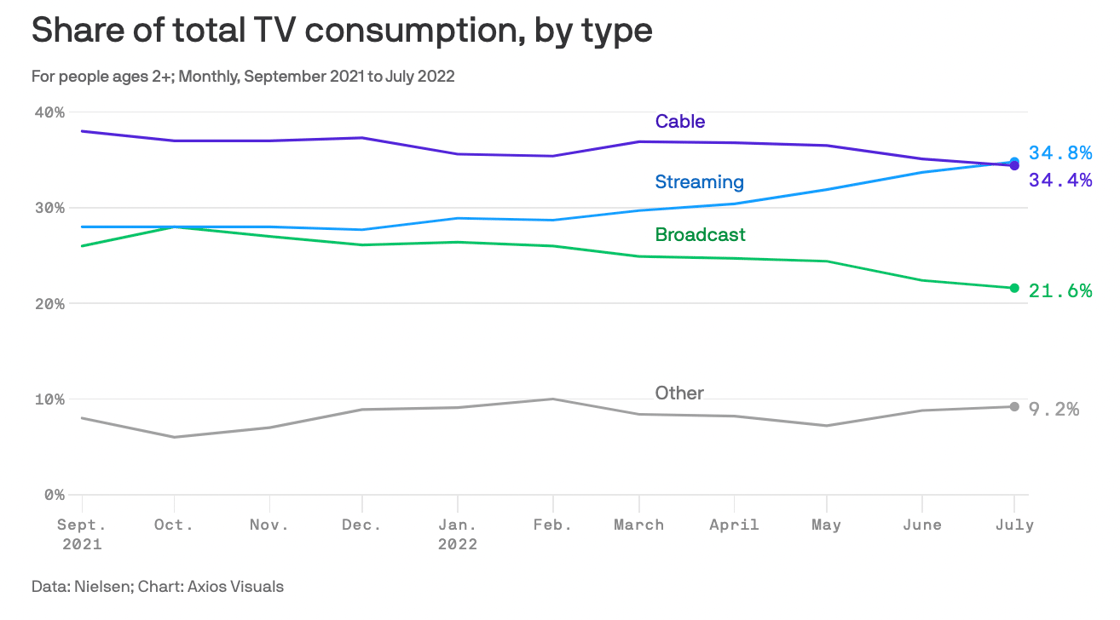
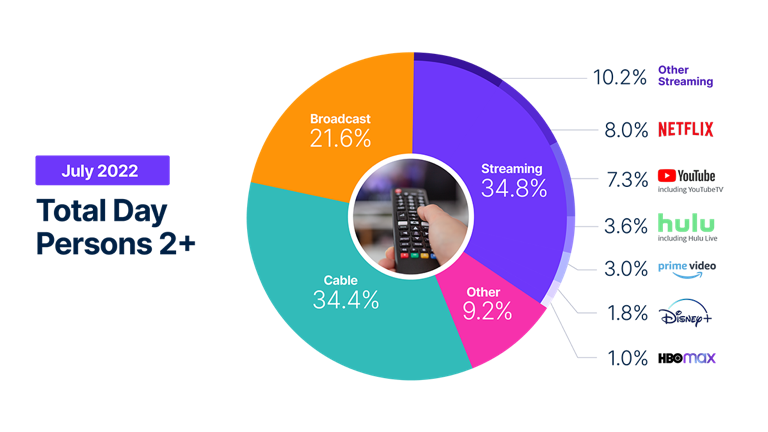
Share of total TV time according to Nielsen:
1) Streaming – 35%
2) Cable – 34%
3) Broadcast – 22%
4) Other – 9%
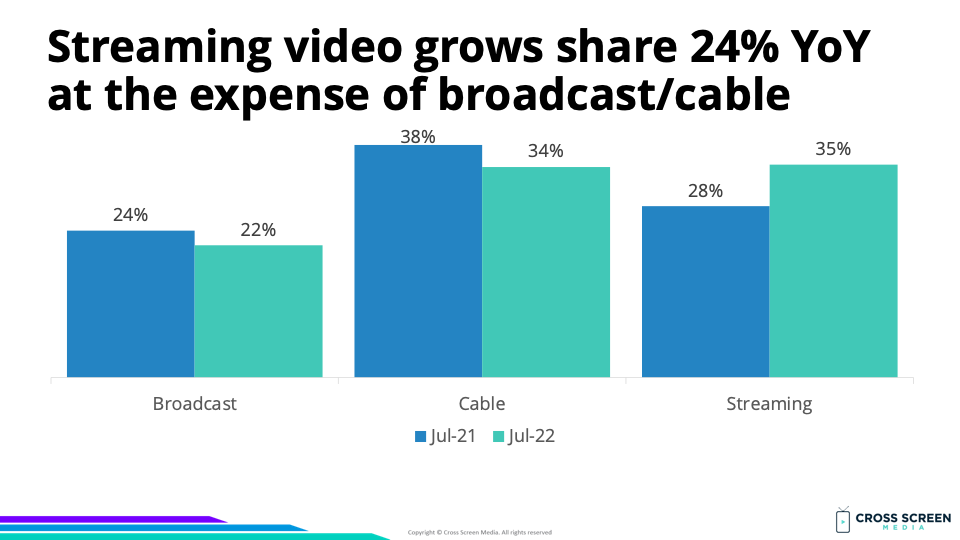
Share of total TV time (video only) according to Nielsen:
1) Streaming – 38%
2) Cable – 38%
3) Broadcast – 24%
Streaming share of total TV time (YoY growth):
1) 2019-Q4 – 19%
2) 2022-Jul – 35% (↑ 83%)
YoY change in total TV time:
1) Streaming – ↑ 24%
2) Cable – ↓ 9%
3) Broadcast – ↓ 10%
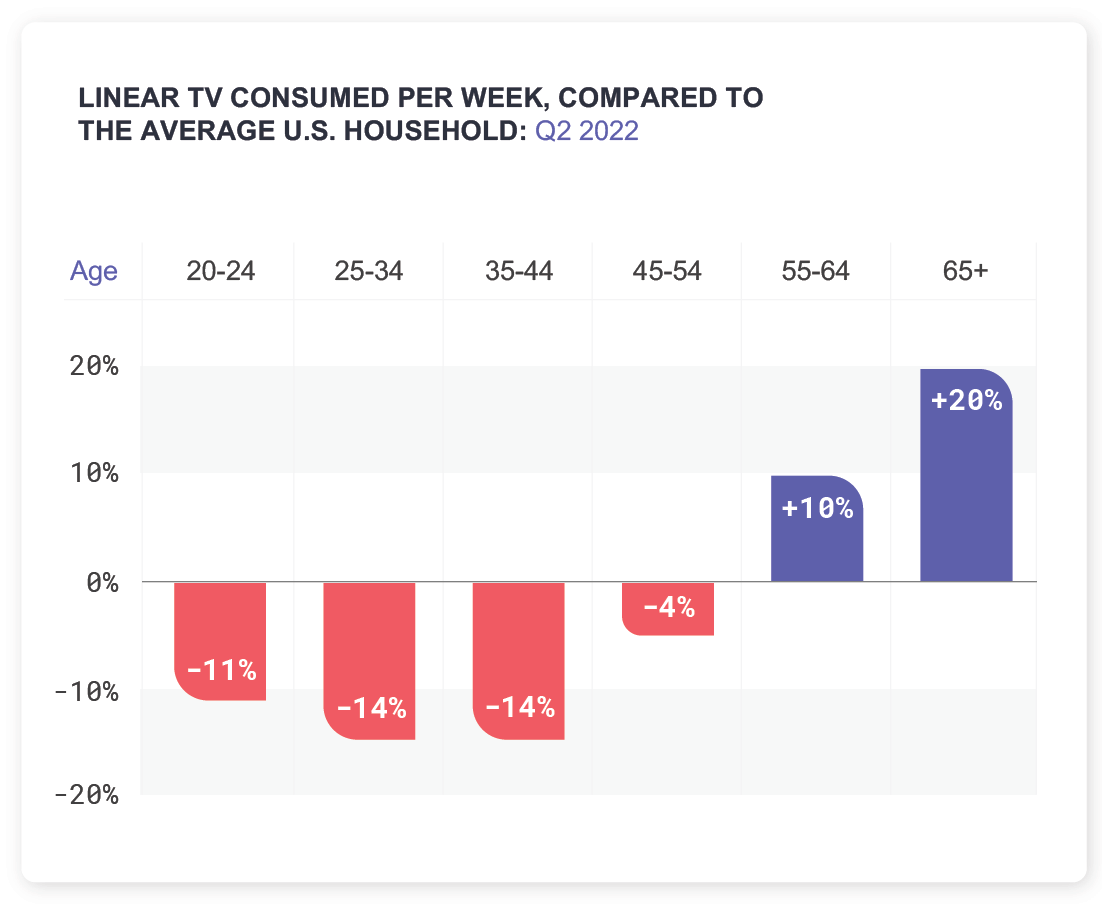
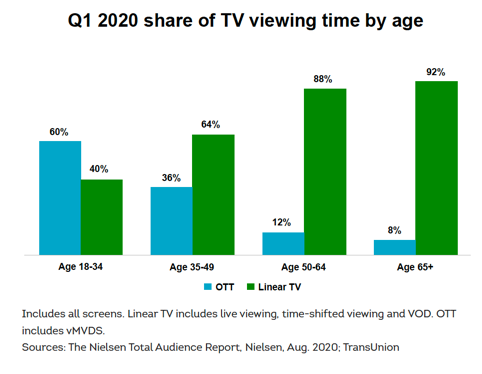
Big question #3: Are all demographic groups watching less linear TV?
Quick answer: No. Samba TV reports both 55-64 and 65+ are watching more TV vs. a year ago.
Linear share of TV viewing time in 2020 by age according to Nielsen:
1) 65+ – 92%
2) 50-64 – 88%
3) 35-49 – 64%
4) 18-34 – 40%
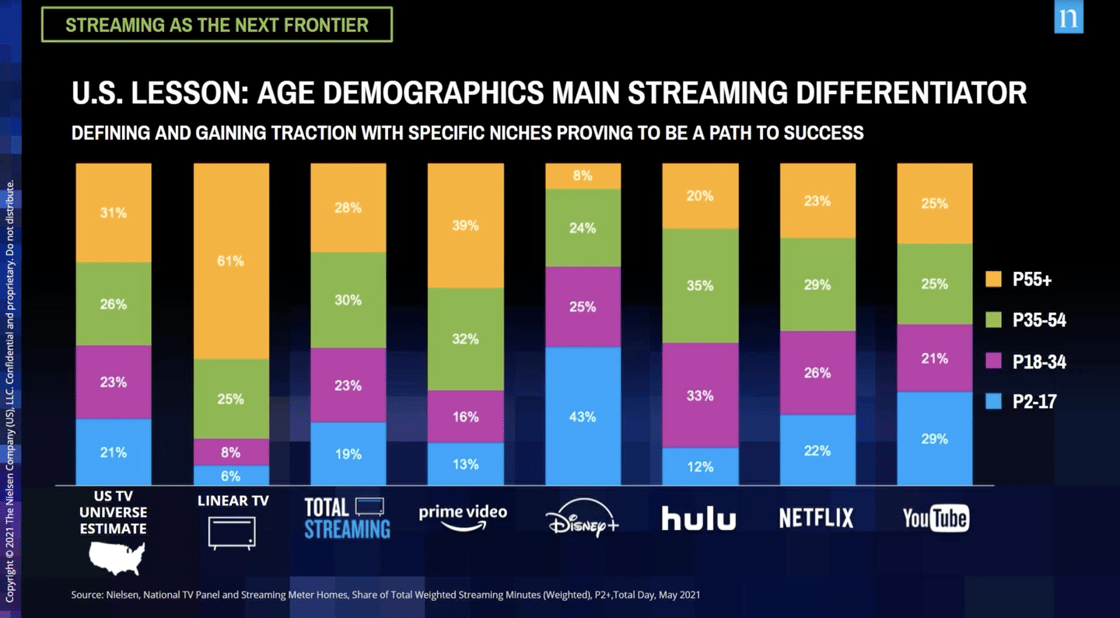
Wild: 55+ watches so much video that both of the following can be true simultaneously.
1) 8-12% of their video time is with streaming
2) They account for 28% of all streaming minutes
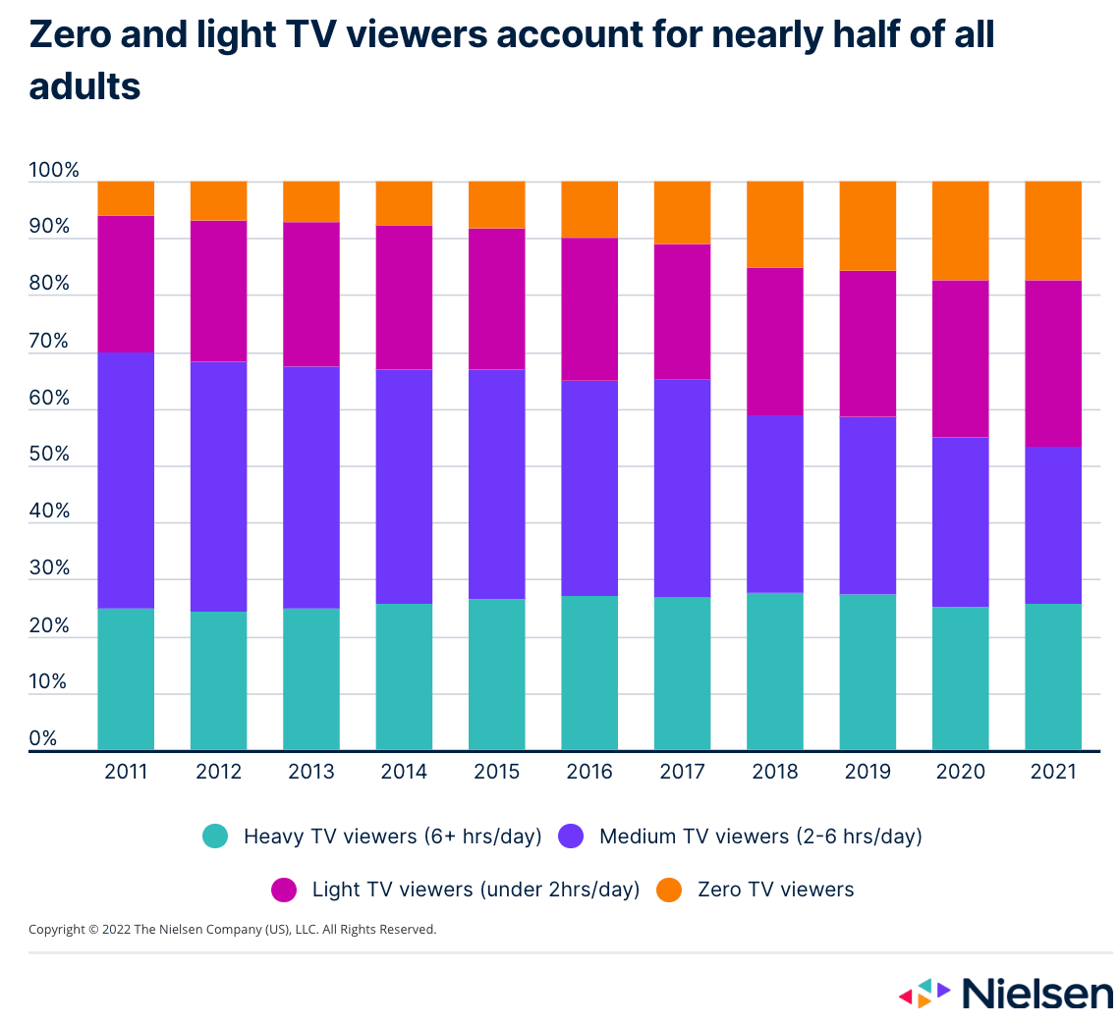
Big question #4: What happens to average TV ad frequency with a growing number of zero/low TV households?
Quick answer: The same ad buy reaches heavy TV viewers 25 times while only 2 times for a light TV viewer.
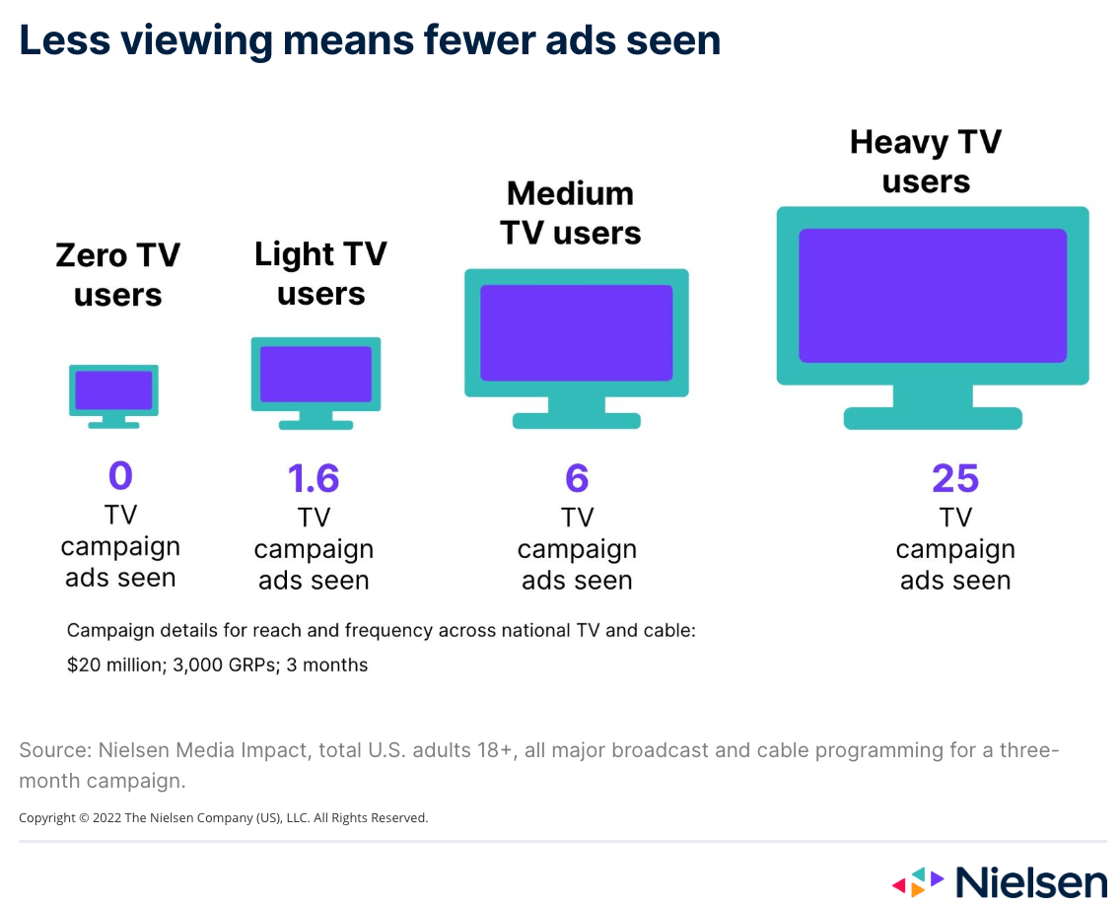
Why this matters: In 2021, 47% of all households were light or zero TV viewers.
Share of adults by TV consumption according to Nielsen:
1) Light TV – 29%
2) Medium TV – 27%
3) Heavy TV – 26%
4) Zero TV – 18%
Share of TV viewers in light/zero consumption bucket:
1) 2011 – 30%
2) 2021 – 47%