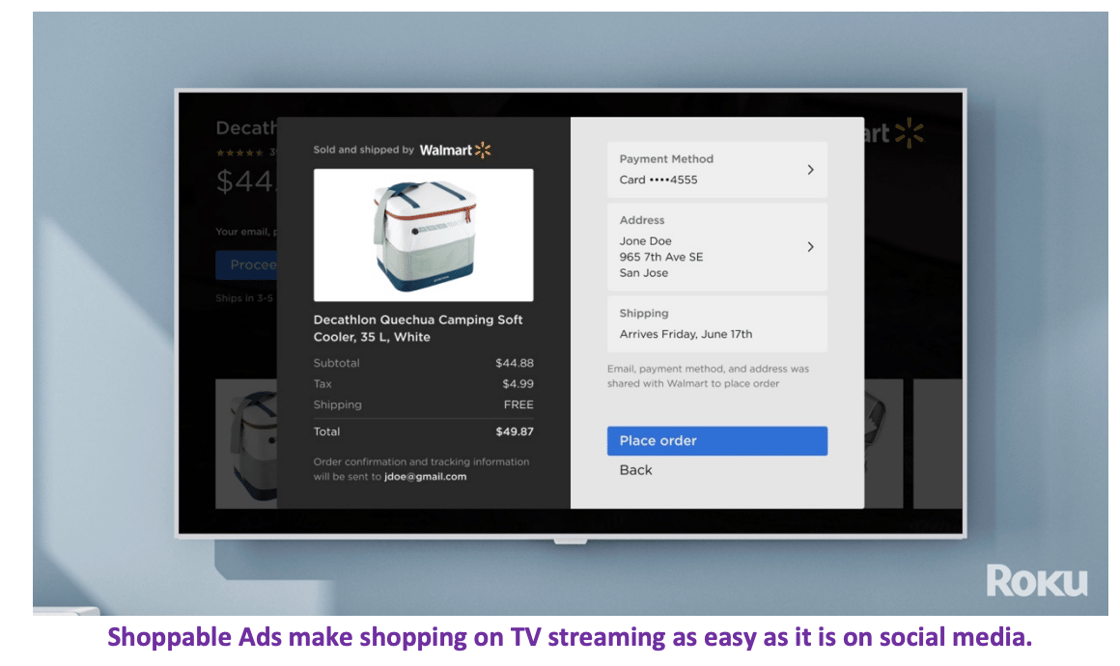
Big news: With Roku Pay, viewers can buy products through shoppable ads.
Why this matters: Advertisers from both brand and direct response are moving into the same video format (connected TV). This will be important since it will dramatically impact the demand part of TV advertising.
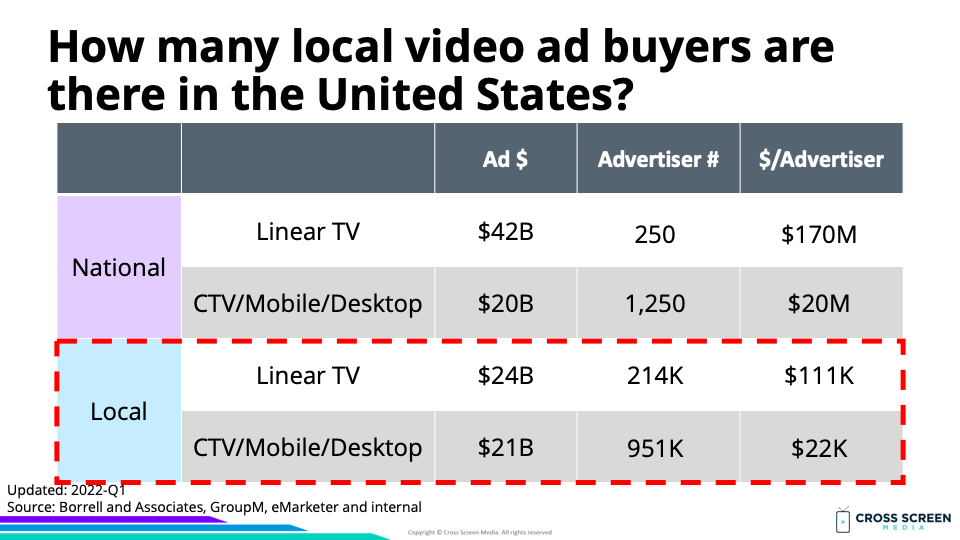
Today: 90% of national TV advertising is purchased by 250 brands, but over 1 million brands buy video advertising. Linear TV ad supply is split between national time (12m+ or 86%) and local time (2m or 14%).
Tomorrow: 1M+ video advertisers compete for the same ad impressions (increased demand), leading to higher network prices.
Bottom line: Advertisers can buy connected TV advertising at the zip code level and value inventory on any part of the funnel (awareness → transaction). The future looks closer to Facebook/YouTube than today’s system.
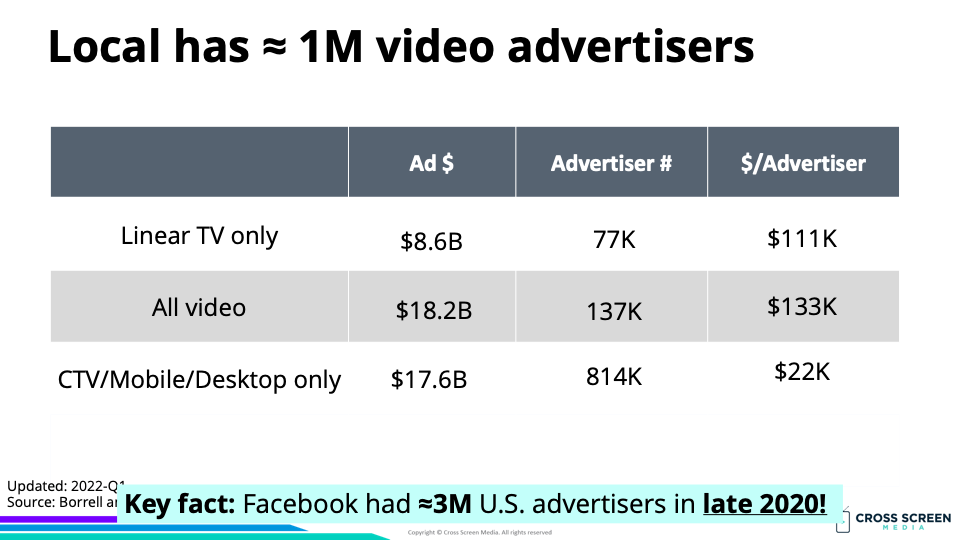
Estimated number of local video ad buyers (% of total):
1) Digital only – 814K (79%)
2) All video – 137K (13%)
3) Linear only – 77K (8%)
Flashback: 55 Billion Reasons to Care About Local Video Ads
Key numbers from Roku’s earnings:
1) 1.8M active accounts added in Q2
2) 63.1M total active accounts
3) 26% YoY increase in advertising revenue
4) 19% YoY increase in streaming hours
Roku active accounts (YoY growth):
1) 2017-Q2 – 15.1M
2) 2018-Q2 – 22.0M (↑ 46%)
3) 2019-Q2 – 30.5M (↑ 39%)
4) 2020-Q2 – 43.0M (↑ 41%)
5) 2021-Q2 – 55.1M (↑ 28%)
6) 2022-Q2 – 63.1M (↑ 15%)
Roku advertising revenue (YoY growth):
1) 2017-Q2 – $46M
2) 2018-Q2 – $90M (↑ 96%)
3) 2019-Q2 – $168M (↑ 86%)
4) 2020-Q2 – $245M (↑ 46%)
5) 2021-Q2 – $532M (↑ 117%)
6) 2022-Q2 – $673M (↑ 26%)
Roku advertising revenue per account (YoY growth):
1) 2017-Q2 – $3.05
2) 2018-Q2 – $4.10 (↑ 35%)
3) 2019-Q2 – $5.50 (↑ 34%)
4) 2020-Q2 – $5.69 (↑ 4%)
5) 2021-Q2 – $9.66 (↑ 70%)
6) 2022-Q2 – $10.67 (↑ 10%)
Roku total streaming hours (YoY growth):
1) 2017-Q2 – 3.5B
2) 2018-Q2 – 5.4B (↑ 54%)
3) 2019-Q2 – 8.8B (↑ 63%)
4) 2020-Q2 – 14.6B (↑ 66%)
5) 2021-Q2 – 17.0B (↑ 19%)
6) 2022-Q2 – 20.7B (↑ 19%)
Roku advertising revenue per streaming hour (YoY growth):
1) 2017-Q2 – $0.013
2) 2018-Q2 – $0.016 (↑ 25%)
3) 2019-Q2 – $0.018 (↑ 9%)
4) 2020-Q2 – $0.017 (↓ 6%)
5) 2021-Q2 – $0.031 (↑ 82%)
6) 2022-Q2 – $0.033 (↑ 6%)
Video: Roku Plunges After Miss