YoY change in pay-TV subscribers:
1) Traditional pay-TV – ↓ 4.7M
2) Streaming pay-TV – ↑ 939K
3) Total pay-TV – ↓ 3.7M
Total pay-TV subscriptions (YoY growth):
1) 2019-Q1 – 91.6M
2) 2020-Q1 – 87.1M (↓ 5%)
3) 2021-Q1 – 83.0M (↓ 5%)
4) 2022-Q1 – 78.7M (↓ 5%)
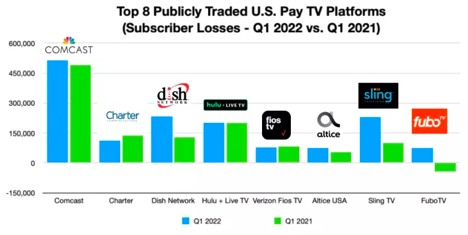
Traditional pay-TV subscriptions (YoY growth):
1) 2019-Q1 – 83.9M
2) 2020-Q1 – 77.5M (↓ 8%)
3) 2021-Q1 – 71.4M (↓ 8%)
4) 2022-Q1 – 66.7M (↓ 7%)
Streaming pay-TV subscriptions (YoY growth):
1) 2019-Q1 – 7.8M
2) 2020-Q1 – 9.6M (↑ 23%)
3) 2021-Q1 – 11.1M (↑ 16%)
4) 2022-Q1 – 12.0M (↑ 8%)
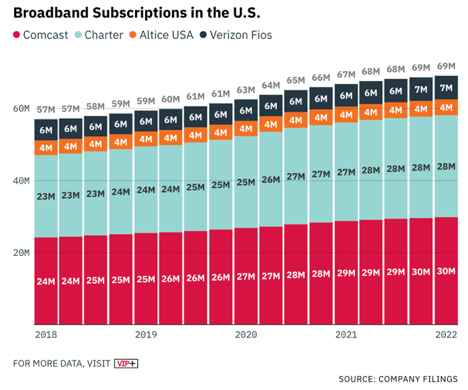
Total broadband subscriptions (YoY growth):
1) 2020-Q1 – 102.4M
2) 2021-Q1 – 107.0M (↑ 4%)
3) 2022-Q1 – 108.8M (↑ 2%)
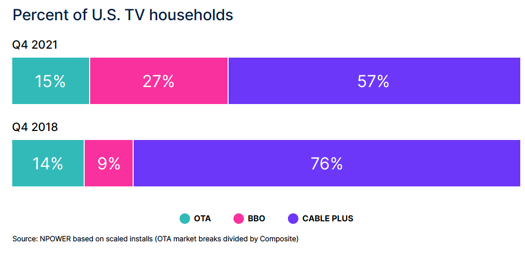
Broadband only share of TV homes according to Nielsen:
1) 2016 – 4%
2) 2018 – 9%
3) 2021 – 27%
Why this matters: Broadband service now reaches 30M more households than pay-TV. Broadband is a better business for cable/telco companies which will only grow in importance as the pay-TV universe approaches 50M households.
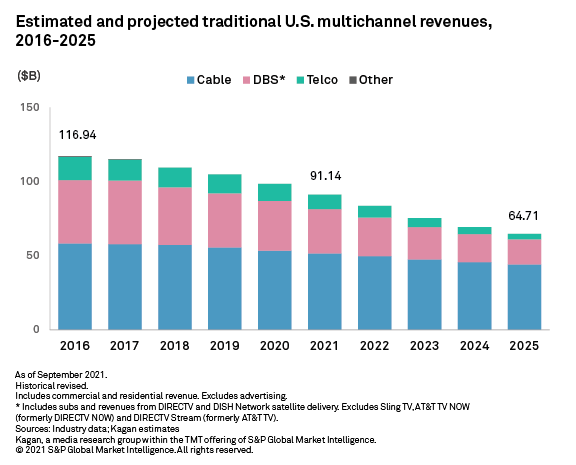
U.S. pay-TV revenue from subscriptions (% change) according to Kagan:
1) 2016 – $117B
2) 2021 – $91B (↓ 22%)
3) 2025 – $65B (↓ 29%)