Four big questions re: the most expensive TV shows ever made:
1) What are the most expensive TV shows ever?
2) Which actors/actresses are paid the most per episode?
3) Why are production/salary costs rising rapidly?
4) How much is each network expected to spend on content in 2022?
Big question #1: What are the most expensive TV shows ever?
Most expensive shows by episode according to Collider:
1) The Lord of the Rings: Rings of Power (Amazon – 2022) – $58M
2) Stranger Things (Netflix – 2016) – $30M
3) WandaVision (Disney+ – 2021) – $25M
4) House of Dragon (HBO – 2022) – $20M
5) The Pacific (HBO – 2010) – $20M
6) The Mandalorian (Disney+ – 2019) – $15M
7) See (Apple TV+ – 2019) – $15M
8) Game of Thrones (HBO – 2011) – $15M
9) The Crown (Netflix – 2016) – $13M
10) Halo (Paramount+ – 2022) – $10M
Big question #2: Which actors/actresses are paid the most per episode?
Highest paid actors/actresses by episode according to Variety:
1) Kevin Costner (Yellowstone – Paramount Network) – $1.3M
2) Mahershala Ali (The Pilot – Onyx Collective) – $1.3M
3) Elisabeth Moss (Shining Girls – Apple TV+) – $1.1M
4) Michael Keaton (Dopesick – Hulu) – $1.0M
5) Harrison Ford (1923 – Paramount+) – $1.0M
6) Helen Mirren (1923 – Paramount+) – $1.0M
7) Will Ferrell (The Shrink Next Door – Apple TV+) – $1.0M
8) Paul Rudd (The Shrink Next Door – Apple TV+) – $1.0M
9) Jason Sudeikis (Ted Lasso – Apple TV+) – $1.0M
10) Sylvester Stallone (Tulsa King – Paramount+) – $1.0M
Big question #3: Why are production/salary costs rising rapidly?
Quick answer: Demand > Supply. As a result, there are more buyers (streaming services, broadcast/cable networks, etc.) than ever before.
Original scripted shows by year (YoY growth) according to FX:
1) 2012 – 288 (↑ 8%)
2) 2013 – 349 (↑ 21%)
3) 2014 – 389 (↑ 11%)
4) 2015 – 422 (↑ 8%)
5) 2016 – 455 (↑ 8%)
6) 2017 – 487 (↑ 7%)
7) 2018 – 495 (↑ 2%)
8) 2019 – 532 (↑ 7%)
9) 2020 – 493 (↓ 7%)
10) 2021 – 559 (↑ 13%)

Quick math on change in attention for scripted shows between 2012-21:
1) Scripted shows – 288 → 559 (↑ 94%)
2) TV households – 115M →121M (↑ 5%)
3) Average daily time with video – 5h 13m → 5h 39m (↑ 8%)
4) Total time with video – ↑ 14%
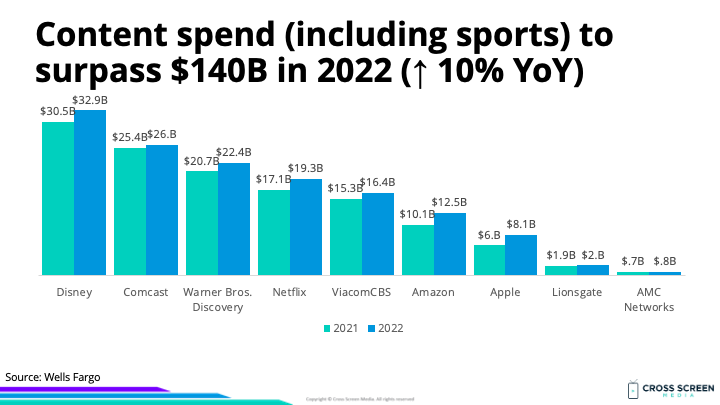
Big question #4: How much is each network expected to spend on content in 2022?
Estimated U.S. content spend by network (YoY growth) in 2022 according to Wells Fargo:
1) Disney – $33B (↑ 8%)
2) Comcast – $26B (↑ 2%)
3) Warner Bros. Discovery – $22B (↑ 8%)
4) Netflix – $19B (↑ 13%)
5) ViacomCBS – $16B (↑ 7%)
6) Amazon – $13B (↑ 24%)
7) Apple – $8B (↑ 35%)
8) Lionsgate – $2B (↑ 5%)
9) AMC Networks – $800M (↑ 4%)
10) Total – $140B (↑ 10%)