Nine big questions re: Netflix:
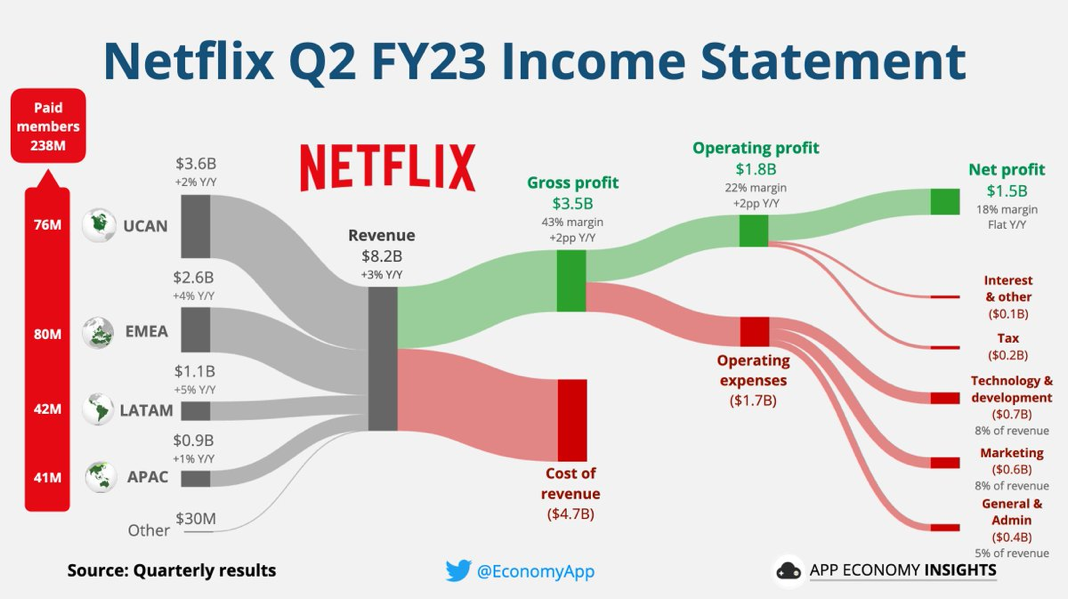
1) How much revenue is Netflix generating?
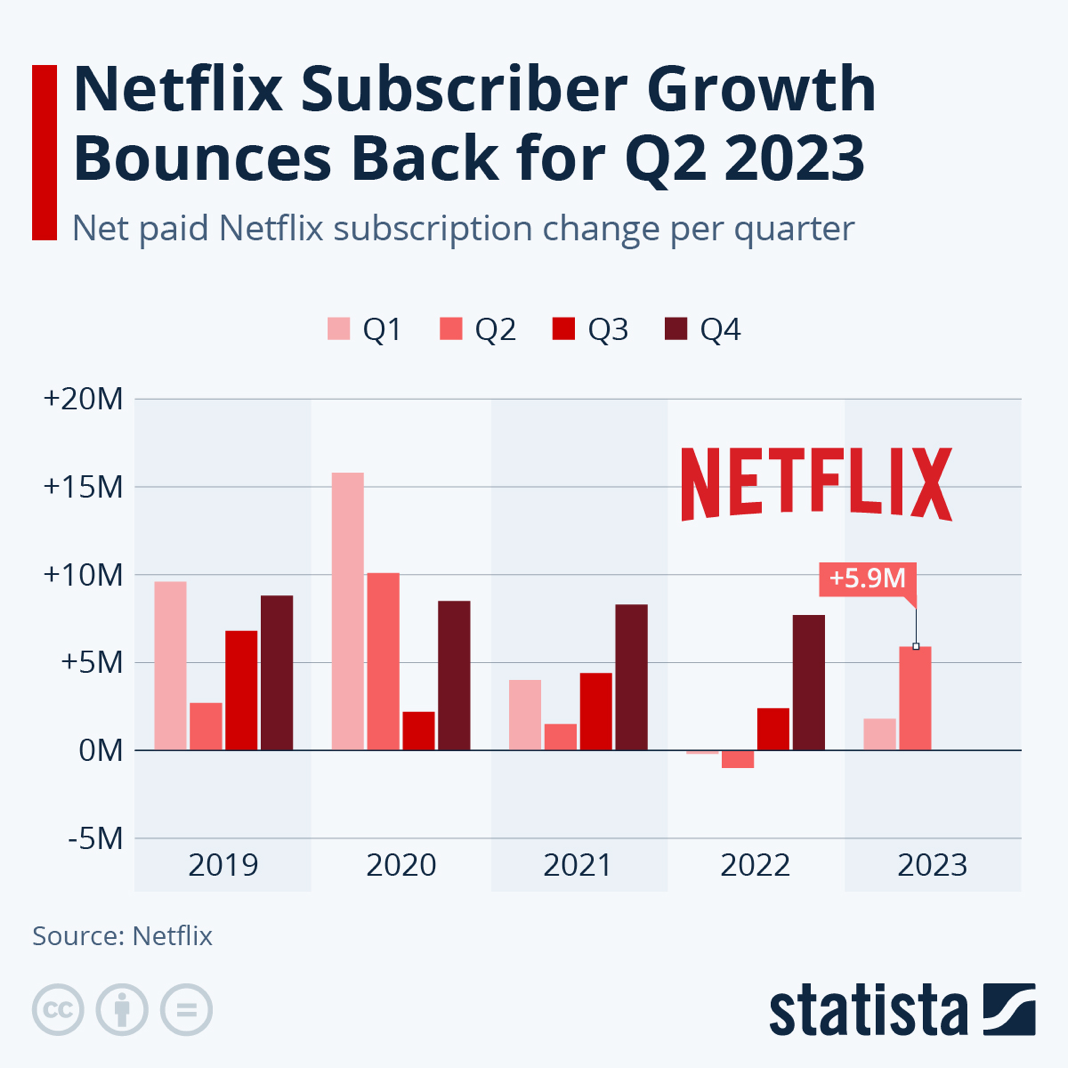
2) How many streaming subscribers does Netflix have?
3) Where is the subscriber growth coming from?
4) How much revenue do they make from each streaming subscriber?
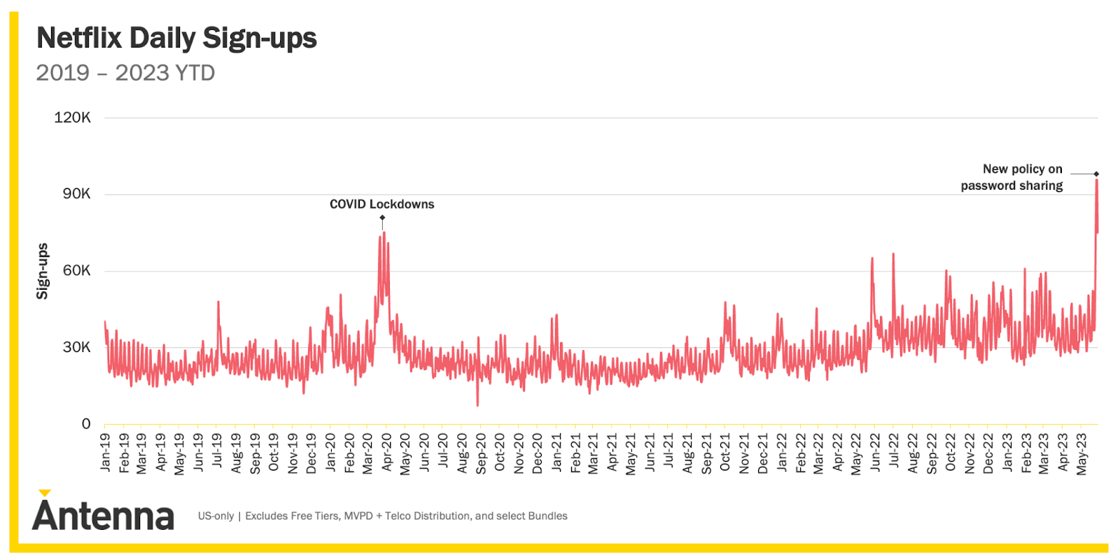
5) What share of new sign-ups comes from the ad-supported offering?
6) Will ad-supported subscribers generate more revenue than ad-free?
7) What share of streaming viewership does Netflix account for?
8) What are the most watched shows ever on Netflix?
9) What share of Netflix viewership comes from original content?
Netflix revenue (YoY growth):
1) 2015-Q2 – $1.6B
2) 2016-Q2 – $2.1B (↑ 28%)
3) 2017-Q2 – $2.8B (↑ 32%)
4) 2018-Q2 – $3.9B (↑ 40%)
5) 2019-Q2 – $4.9B (↑ 26%)
6) 2020-Q2 – $6.1B (↑ 25%)
7) 2021-Q2 – $7.3B (↑ 19%)
8) 2022-Q2 – $8.0B (↑ 9%)
9) 2023-Q2 – $8.2B (↑ 3%)
Netflix subscribers (YoY growth):
1) 2015-Q2 – 65.6M
2) 2016-Q2 – 83.2M (↑ 27%)
3) 2017-Q2 – 99.0M (↑ 19%)
4) 2018-Q2 – 124.4M (↑ 26%)
5) 2019-Q2 – 151.6M (↑ 22%)
6) 2020-Q2 – 193.0M (↑ 27%)
7) 2021-Q2 – 209.2M (↑ 8%)
8) 2022-Q2 – 220.7M (↑ 5%)
9) 2023-Q2 – 238.4M (↑ 8%)
Interesting: The password-sharing crackdown led to a record day for new sign-ups.
Video: Netflix outlook disappoints, set for worst drop this year

Big question #3: Where is the subscriber growth coming from?
Netflix subscriber growth (% of total):
1) International – 4.7M (80%)
2) U.S./Canada – 1.2M (20%)
3) Total – 5.9M
Netflix subscribers (% of total):
1) International – 162.8M (68%)
2) U.S./Canada – 75.6M (32%)
3) Total – 238.4M
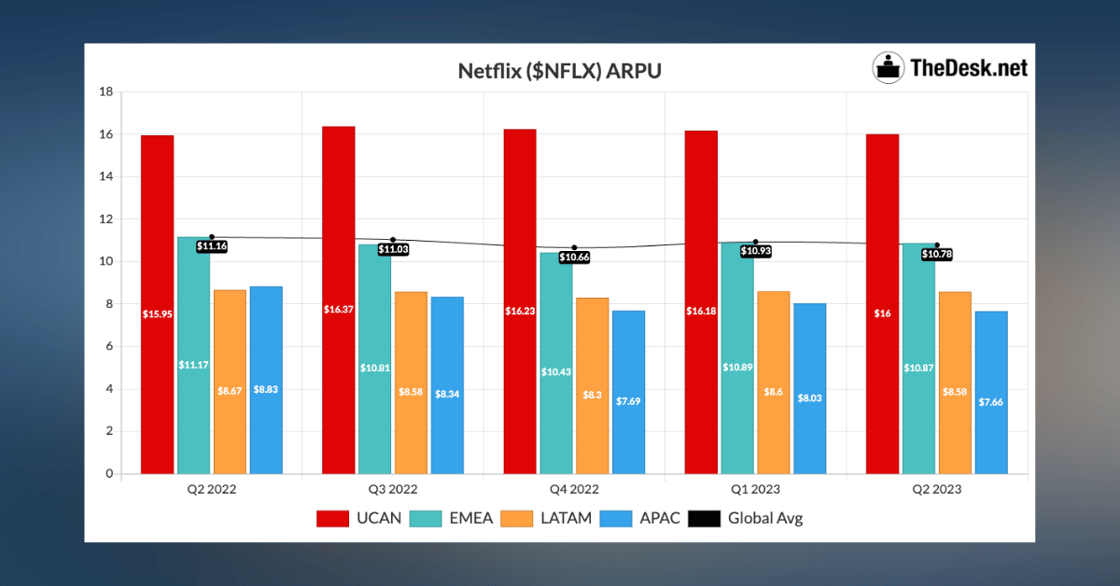
Big question #4: How much revenue do they make from each streaming subscriber?
Monthly ARPU for Netflix in U.S./Canada (YoY growth):
1) 2019-Q2 – $12.52
2) 2020-Q2 – $13.25 (↑ 6%)
3) 2021-Q2 – $14.54 (↑ 10%)
4) 2022-Q2 – $15.95 (↑ 10%)
5) 2023-Q2 – $16.00 (↑ 0%)
Big question #5: What share of new sign-ups comes from the ad-supported offering?
Quick answer: ≈ 20%
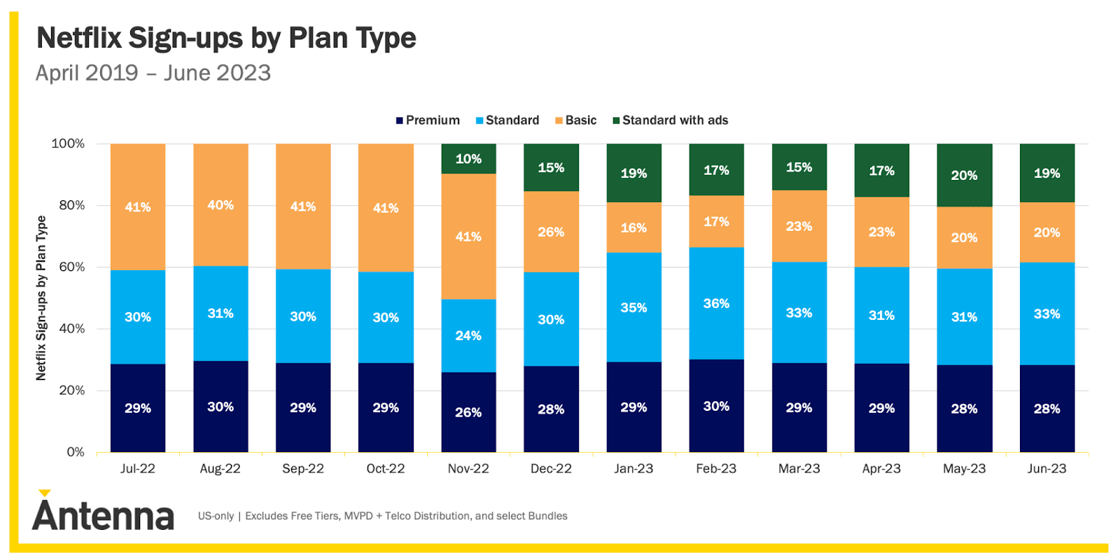
Bottom line: Netflix currently has 1.5M ad-supported subscribers in the U.S.
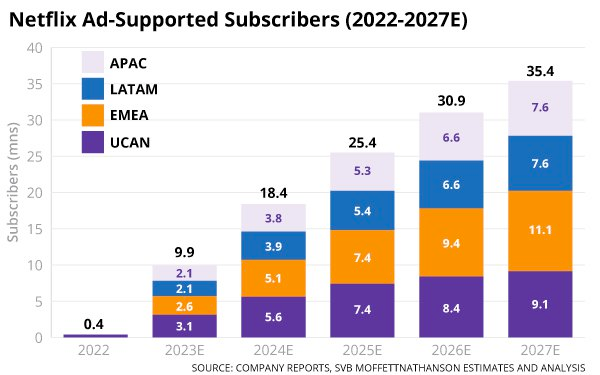
Big question #6: Will ad-supported subscribers generate more revenue than ad-free?
Quick answer: Yes. Netflix recently discontinued it’s basic tier ($9.99 without ads) to drive “downgrades” to the ad-supported plan ($6.99). They would only do this if they felt confident ARPU would increase.
Quote from Ben Thompson – Author/Founder @ Stratechery:
“The first step in increasing advertising scale is (1) making the advertising tier more attractive, which Netflix did by improving the product experience to the “standard” level, and (2) increasing the delta between the advertising tier and the non-advertising tier, thus capturing more price-sensitive customers. This is what happened last week.”
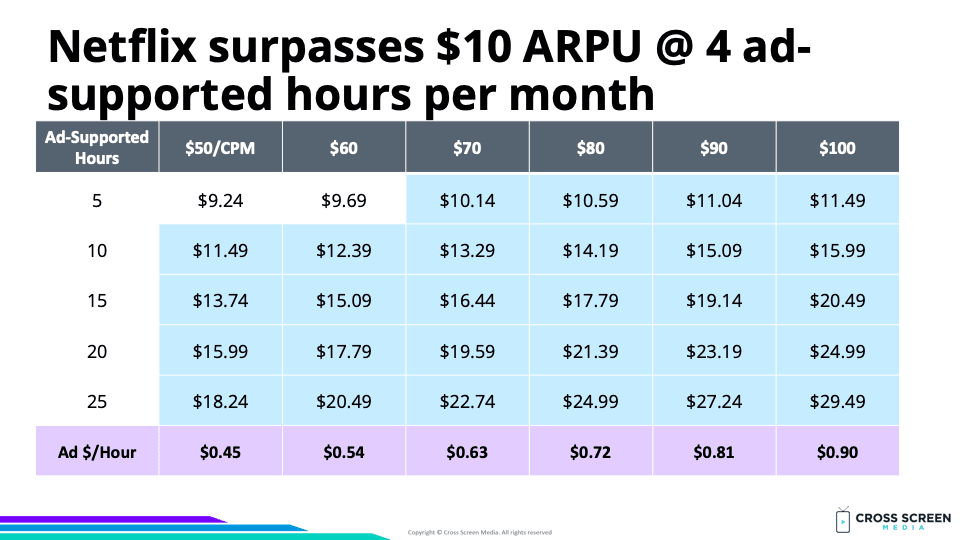
Quick math on the advertising model for Netflix:
1) Ad minutes/hour – 4.5
2) 30s spots/hour – 9
3) CPM $ – ≈ $80
4) $/spot – $0.08
5) Ad revenue/hour – $0.72
6) ARPU > $9.99 @ 4.2 hours ($6.99 + $3.00 = $9.99)
Big question #7: What share of streaming viewership does Netflix account for?
Quick answer: Netflix accounts for 8% of total TV time and 22% of streaming TV time.
.png?width=1120&upscale=true&name=27B3.8-JUN2023E(Netflix).png)
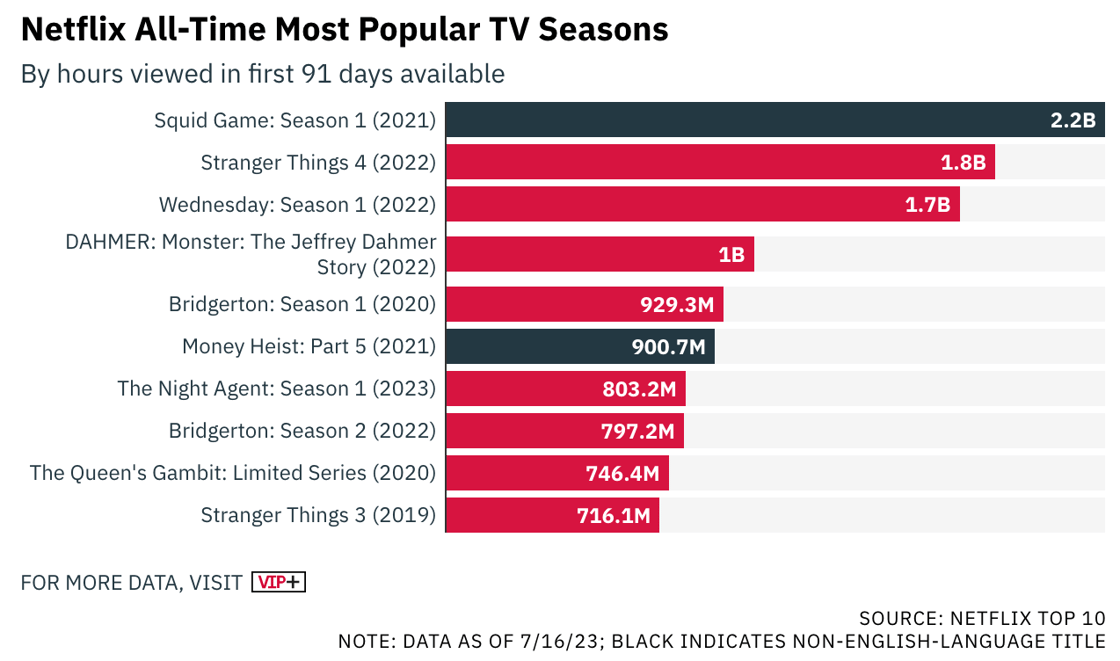
Big question #8: What are the most watched shows ever on Netflix?
Netflix’s all-time most popular TV seasons by hours viewed:
1) Squid Games: S1 (2021) – 2.2B
2) Stranger Thing S4 (2022) – 1.8B
3) Wednesday S1 (2022) – 1.7B
4) Dahmer (2022) – 1.0B
5) Bridgerton S1 (2020) – 929M
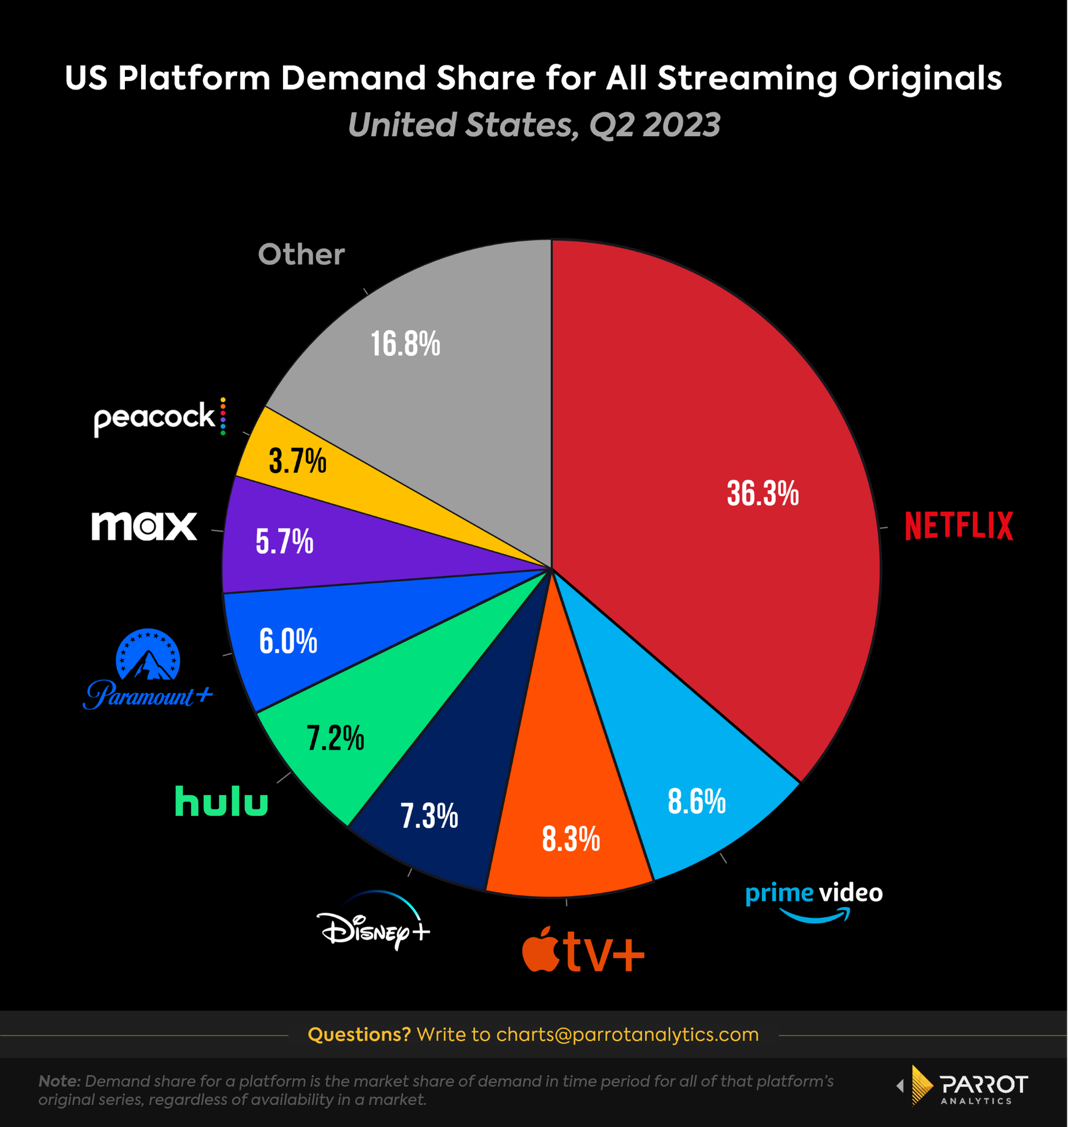
Big question #9: What share of Netflix viewership comes from original content?
Quick answer: ≈ 58%
Interesting: Netflix’s share of consumption for original streaming content is still 4X their closest competitor (Prime Video).