
Six big questions re: media fragmentation:
1) How many people watched the finale of M*A*S*H?
2) What would an equivalent number of viewers be today?
3) How does the M*A*S*H sign-off compare to other finales?
4) Why does no current scripted show get close?
5) How do we watch TV today?
6) How do we watch video today?
Setting the table: M*A*S*H ended 40 years ago with a viewership number unmatched by any other scripted TV series.
Big question #1: How many people watched the finale of M*A*S*H?
Quick answer: 106M individuals (≈ 50M HH). 60% of all TV households (83M in 1983) tuned in.
Big question #2: What would an equivalent number of viewers be today?
Quick math on M*A*S*H finale in 2022 terms:
1) 123.8M TV HH today (↑ 49% since 1983)
2) 106M viewers in 1983
3) 1.49 * 106M = 157M viewers in 2022 terms
Yikes: 1M people in New York City flushed the toilet immediately after the M*A*S*H finale requiring 6.7M gallons of water!
Quote from Peter Barrett – Spokesman @ New York City’s Department of Environmental Protection:
“In speaking to engineers who’ve been around 30 or 40 years, they haven’t encountered anything like this before.”
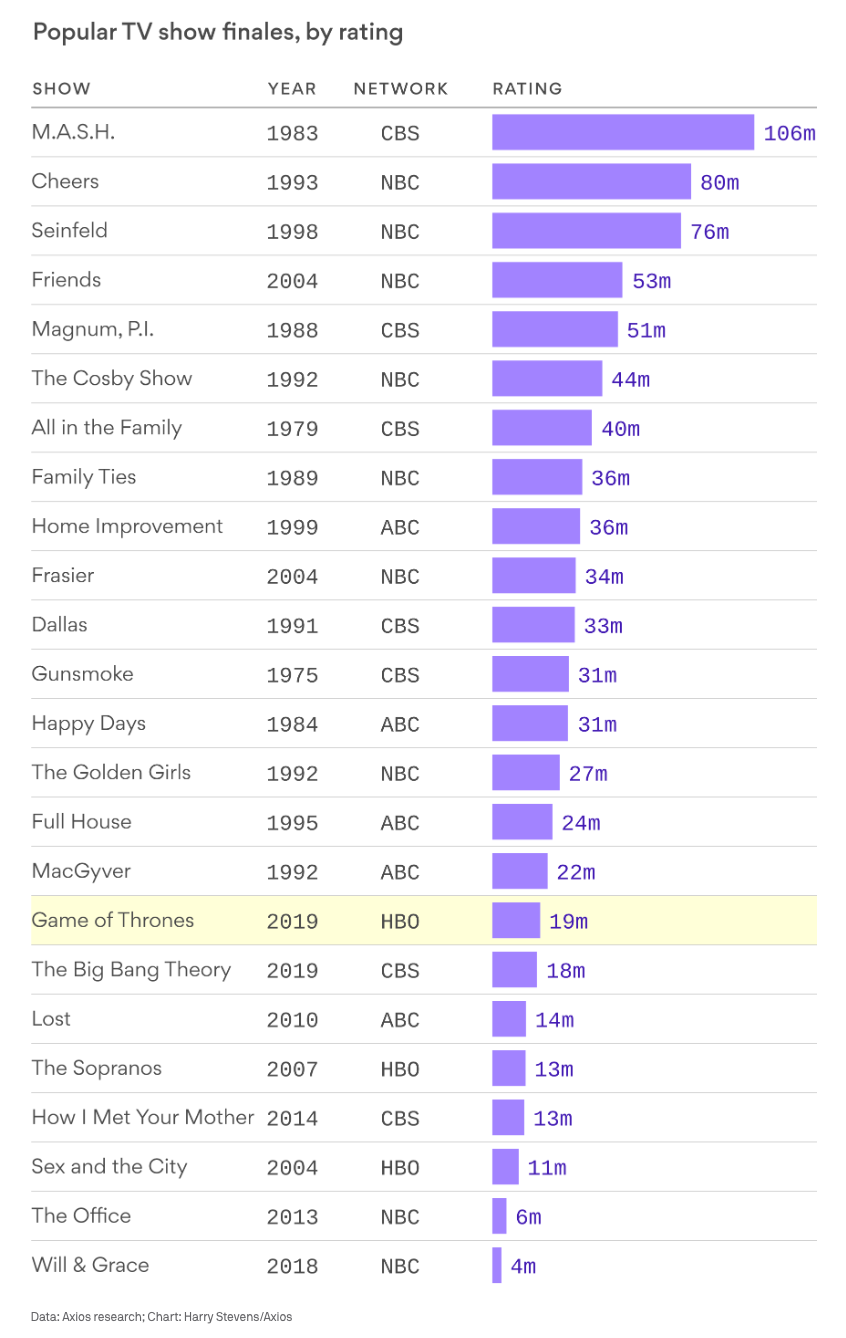
Big question #3: How does the M*A*S*H sign-off compare to other finales?
Most viewed TV finales according to Axios:
1) M*A*S*H (1983) – 106M
2) Cheers (1993) – 80M
3) Seinfeld (1998) – 76M
4) Friends (2004) – 53M
5) Magnum, P.I. (1988) – 51M
Big question #4: Why does no current scripted show get close?
Quick answer: The media environment is extremely fragmented through an explosion of choice. We have thousands of different shows we can watch at any time. When M*A*S*H signed off, the Fox network was 3 years from launching, and less than 1/4 of U.S. homes had cable TV.
.png?width=1120&upscale=true&name=C2509-J1(MASH).png) |
Bottom line: In 1983, this is what your TV options looked like on a Monday night.
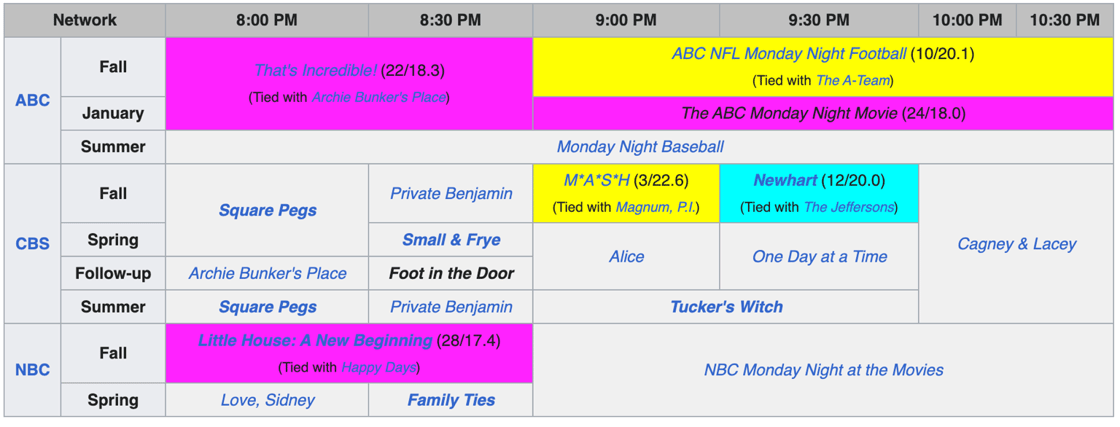
Share of American households in 1983:
1) Broadcast – 96%
2) Cable – 22%
3) Streaming – 0%
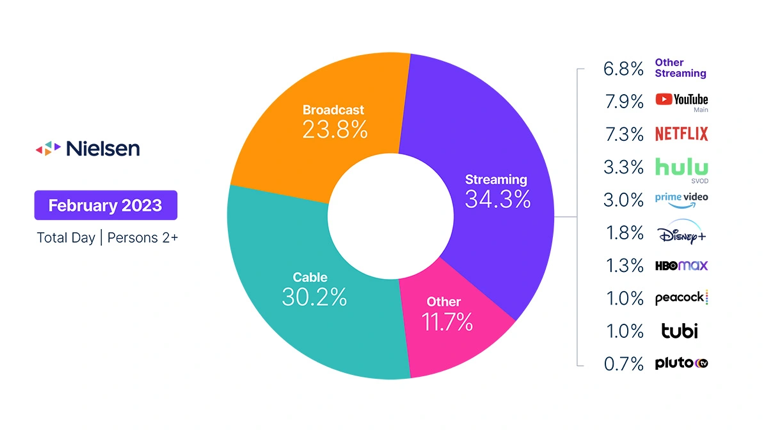
Big question #5: How do we watch TV today?
Share of total TV time according to Nielsen:
1) Streaming – 34%
2) Cable – 30%
3) Broadcast – 24%
4) Other – 12%
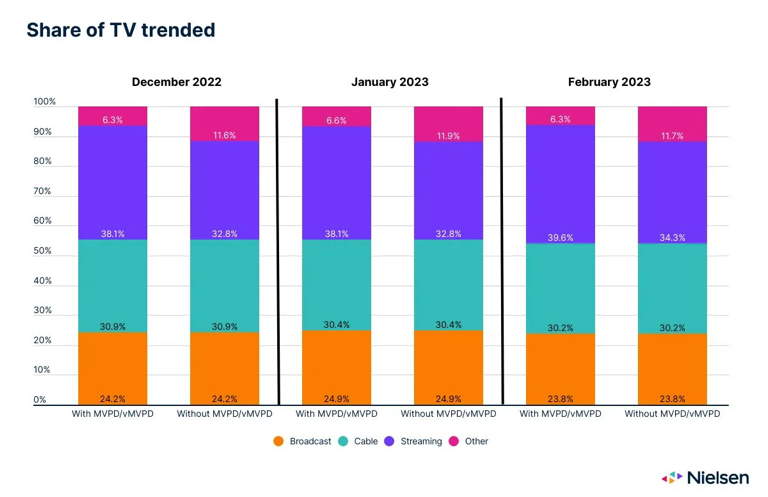
Note: Nielsen made a methodology change with the February data.
Why this matters: Streaming of broadcast/cable content was previously double-counted by Nielsen. The February data removes it from streaming and only counts it as broadcast/cable.
Interesting: 5.3% of total TV time was spent streaming broadcast/cable content in February.
Video: Methodology change explained

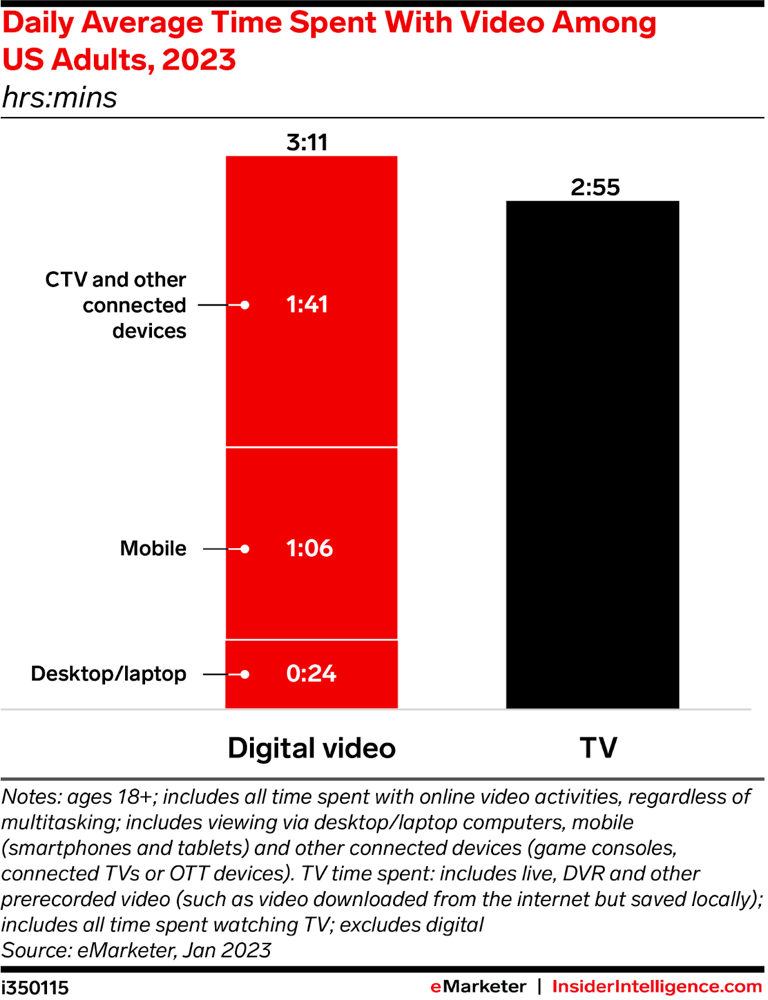
Big question #6: How do we watch video today?
Time spent with video by device (% of total) according to eMarketer:
1) Linear TV – 2h 55m (48%)
2) Streaming TV – 1h 41m (28%)
3) Mobile – 1h 6m (18%)
4) Desktop/Laptop – 0h 24m (7%)
 |

