Seven big questions re: the movie theater business model in 2024:
1) How has the box office performed this year?
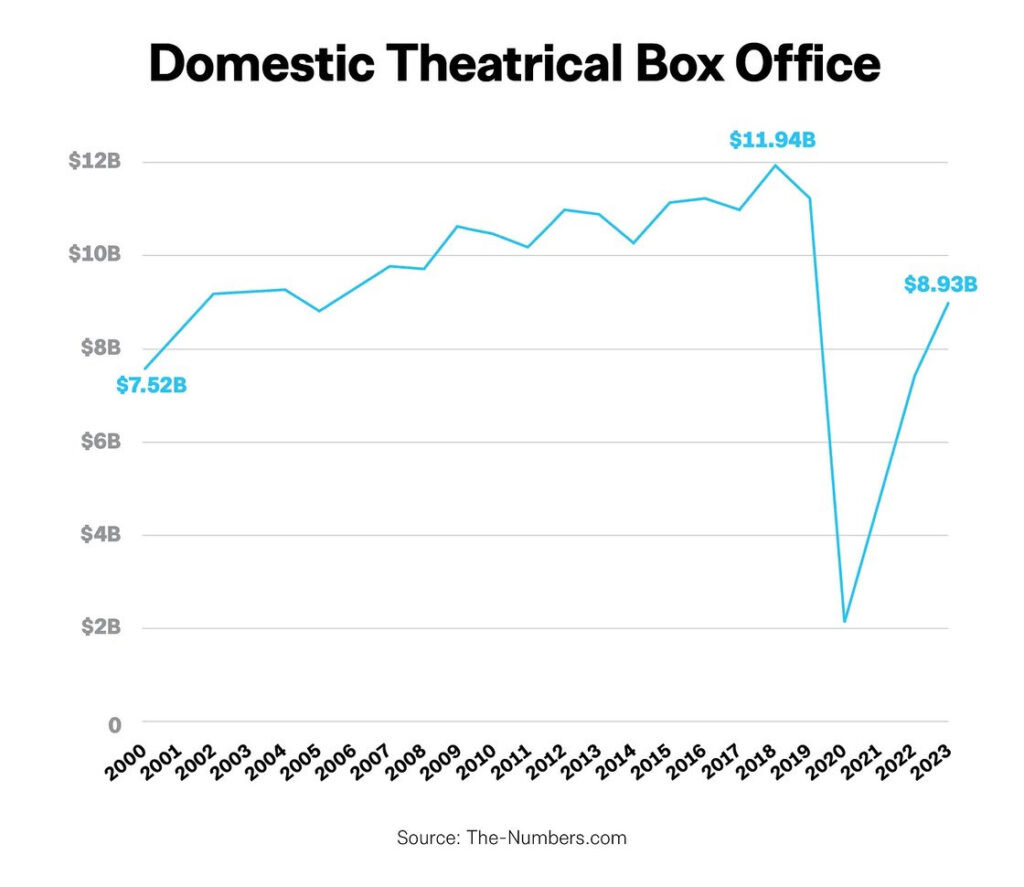
2) Has box office revenue returned to pre-pandemic levels?
3) What drives the decline in box office revenue?
4) What share of box office revenue comes from outside the U.S.?
5) How many movie theaters are in the U.S.?
6) What are the biggest movie releases ever?
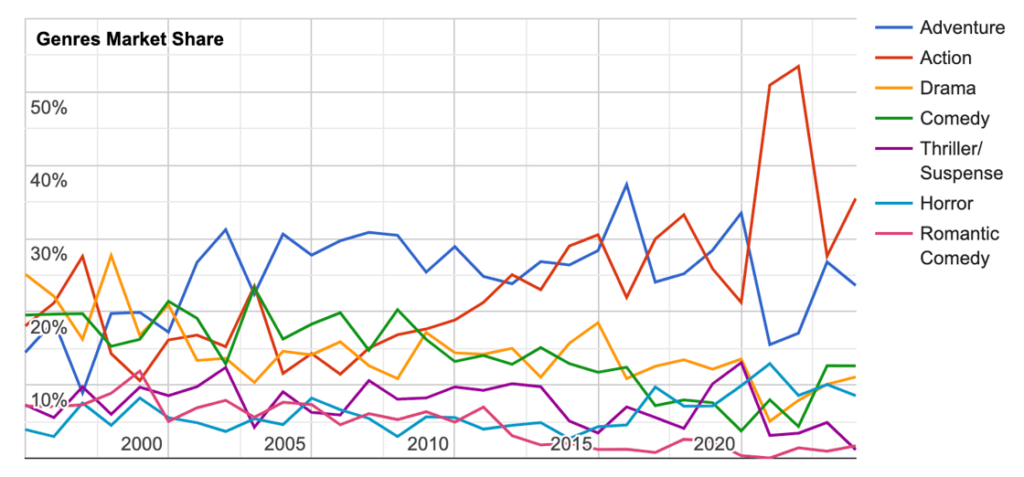
7) What genres generate the most box office revenue?
Flashback: The Economics of Movie Theaters in 2023
Big question #1: How has the box office performed this year?
Quick answer: ↓ 18% vs. 2023 and ↓ 36% vs. 2019.
U.S. box office revenue (YoY growth) through July 9th, according to Box Office Mojo:
1) 2019 – $6.0B
2) 2020 – $1.8B (↓ 70%)
3) 2021 – $1.2B (↓ 34%)
4) 2022 – $4.1B (↑ 245%)
5) 2023 – $4.7B (↑ 15%)
6) 2024 – $3.8B (↓ 18%)

Big question #2: Has box office revenue returned to pre-pandemic levels?
Quick answer: Last year’s box office was 21% lower than the year before the pandemic (2019).
U.S. box office revenue (YoY growth) according to Box Office Mojo:
1) 2014 – $10.4B (↓ 5%)
2) 2015 – $11.1B (↑ 7%)
3) 2016 – $11.4B (↑ 2%)
4) 2017 – $11.1B (↓ 3%)
5) 2018 – $11.9B (↑ 7%)
6) 2019 – $11.3B (↓ 5%)
7) 2020 – $2.1B (↓ 81%)
8) 2021 – $4.5B (↑ 113%)
9) 2022 – $7.4B (↑ 64%)
10) 2023 – $8.9B (↑ 21%)

Big question #3: What drives the decline in box office revenue?
Quick answer: Matthew Ball points out that we have dropped from nearly 4 trips to the movies per year to less than 2.
Movie tickets purchased per person according to The Numbers:
1) 2004 – 5.1
2) 2014 – 4.0
3) 2024P – 1.8

Wow: In the 1930s, the average American went to 30+ movies yearly! 1.3% of consumer spending was on movies vs. 0.09% today (93% less.)
Change in movie tickets purchased by age between 2009-19:
1) 18-24 – ↓ 44%
2) 12-17 – ↓ 38%
3) 2-11 – ↓ 29%
4) Average – ↓ 19%
Big question #4: What share of box office revenue comes from outside the U.S.?
Quick answer: ≈ 75%

Big question #5: How many movie theaters are in the U.S.?
U.S. movie screens (YoY growth) according to the National Association of Theater Owners:
1) 2019 – 41K (↑ 1%)
2) 2020 – 41K (↓ 0%)
3) 2021 – 40K (↓ 2%)
4) 2022 – 39K (↓ 3%)
5) 2023 – 38K (↓ 3%)
Big question #6: What are the biggest movie releases ever?
Top-grossing movies of all time according to Box Office Mojo:
1) Avatar (2009) – $2.9B
2) Avengers: Endgame (2019) – $2.8B
3) Avatar: The Way of Water (2022) – $2.3B
4) Titanic (1997) – $2.3B
5) Star Wars: Episode VII – The Force Awakens (2015) – $2.1B
6) Avengers: Infinity War (2018) – $2.1B
7) Spider-Man: No Way Home (2021) – $1.9B
8) Jurassic World (2015) – $1.7B
9) The Lion King (2019) – $1.7B
10) The Avengers (2012) – $1.5B
Big question #7: What genres generate the most box office revenue?
Quick answer: Action movies have led the way in recent years. 2022 was an all-time high at 54%. Over the past 30 years, the average has been 23%.
Box office revenue share for action movies according to The Numbers:
1) 2003 – 24%
2) 2013 – 23%
3) 2023 – 28%


