Eight big questions re: the movie theaters business model in 2023:
1) Has box office revenue returned to pre-pandemic levels?
2) What share of box office revenue comes from outside the U.S.?
3) How many movie theatres are in the U.S.?
4) How do people prefer to watch movies?
5) Are all movies going direct-to-streaming?
6) How do direct-to-streaming movies make money?
7) What are the biggest movie releases ever?
8) What genres generate the most box office revenue?
Big question #1: Has box office revenue returned to pre-pandemic levels?
Quick answer: No. 2022 was down 35% from 2019.
U.S. box office revenue (YoY growth) according to Box Office Mojo:
1) 2013 – $10.9B (↑ 1%)
2) 2014 – $10.4B (↓ 5%)
3) 2015 – $11.1B (↑ 7%)
4) 2016 – $11.4B (↑ 2%)
5) 2017 – $11.1B (↓ 3%)
6) 2018 – $11.9B (↑ 7%)
7) 2019 – $11.3B (↓ 5%)
8) 2020 – $2.1B (↓ 81%)
9) 2021 – $4.5B (↑ 113%)
10) 2022 – $7.4B (↑ 64%)

U.S. box office revenue (YoY growth) over the Independence Day weekend, according to Box Office Mojo:
1) 2021 – $87M
2) 2022 – $224M (↑ 156%)
3) 2023 – $196M (↓ 12%)
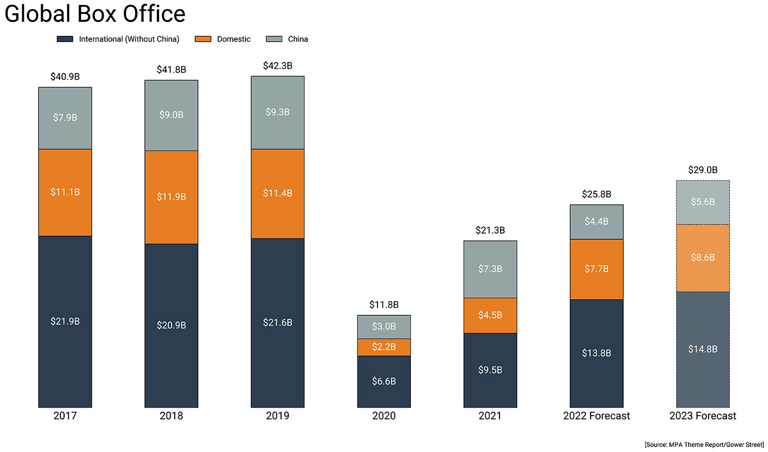
Big question #2: What share of box office revenue comes from outside the U.S.?
Quick answer: ≈ 70%
Big question #3: How many movie theaters are in the U.S.?
U.S. movie screens (YoY growth) according to the National Association of Theater Owners:
1) 2019 – 41K (↑ 1%)
2) 2020 – 41K (↓ 0%)
3) 2021 – 40K (↓ 2%)
4) 2022 – 39K (↓ 3%)
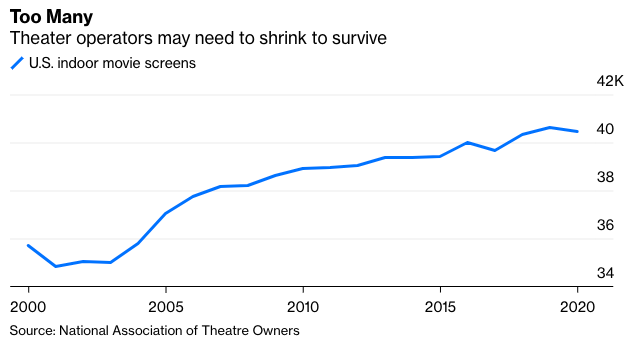
Quick math on movie theater business between 2000-19:
1) Indoor movie screens – ↑ 13%
2) Ticket sales – ↓ 13%
3) AVG ticket price – ↑ 70%
4) Ticket revenue per indoor screen – ↑ 30%
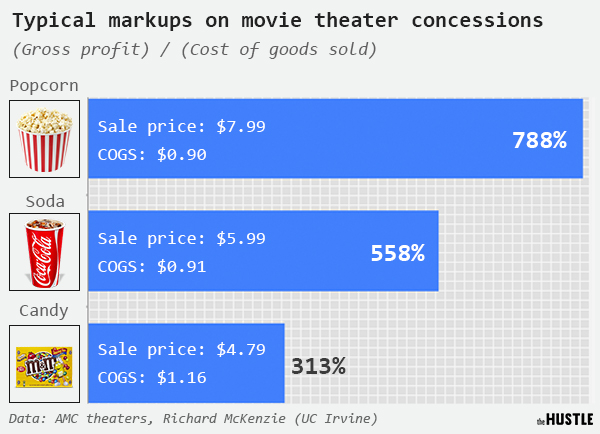
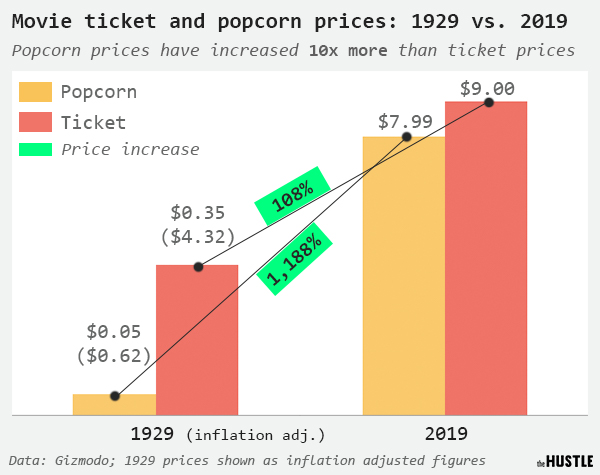
Reminder: Movie theaters generate more profit from a tub of popcorn (≈ $7) than a pair of movie tickets (≈ $6)
Typical markup (% of total) for movie theatre popcorn according to The Hustle:
1) Cost (COGS) – $0.90 (11%)
2) Markup (gross profit) – $7.10 (89%)
3) Retail price – $8.00
Movie theatre inflation since 1929:
1) Ticket prices – ↑ 108%
2) Popcorn – ↑ 1,188%
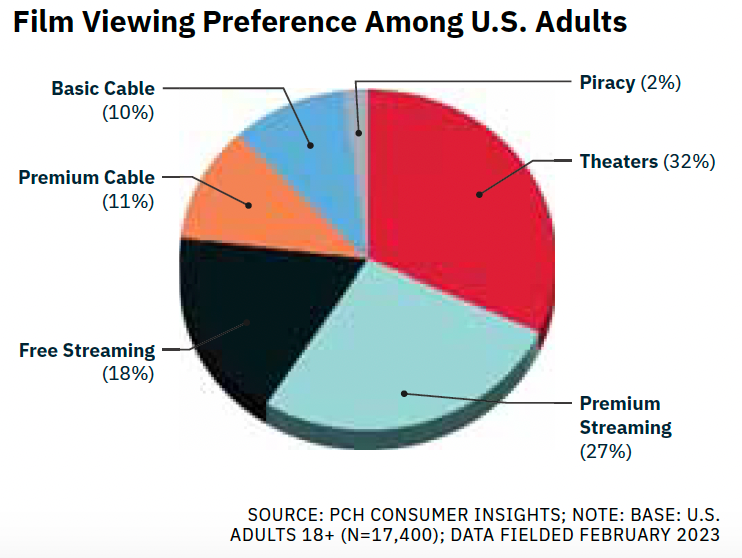
Big question #4: How do people prefer to watch movies?
Movie viewing preference according to PCH Research:
1) Theaters – 32%
2) Premium streaming – 27%
3) Free streaming – 18%
4) Premium cable – 11%
5) Basic cable – 10%
6) Piracy – 2%
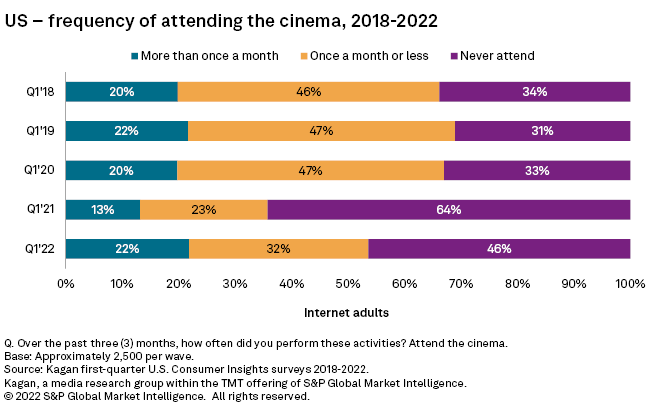
Share of adults who never attend movies in a theatre, according to Kagan:
1) 2018 – 34%
2) 2019 – 31%
3) 2020 – 33%
4) 2021 – 64%
5) 2022 – 46%
Big question #5: Are all movies going direct-to-streaming?
Quick answer: No. 496 movies still went to theaters last year.
Movie releases (YoY change) according to Box Office Mojo:
1) 2019 – 910 (↑ 5%)
2) 2020 – 456 (↓ 50%)
3) 2021 – 440 (↓ 4%)
4) 2022 – 496 (↑ 13%)
Quote from Om Malik:
“We went from drive-in theaters to indoor theaters to multiplexes. And that is a good arc to follow to understand where we are going. The driving forces of change in the movie experience have been the human desire for comfort and convenience. And above all, property values — each change in movie viewing maybe be driven by technology, but it has been about deriving maximum value from the land.”
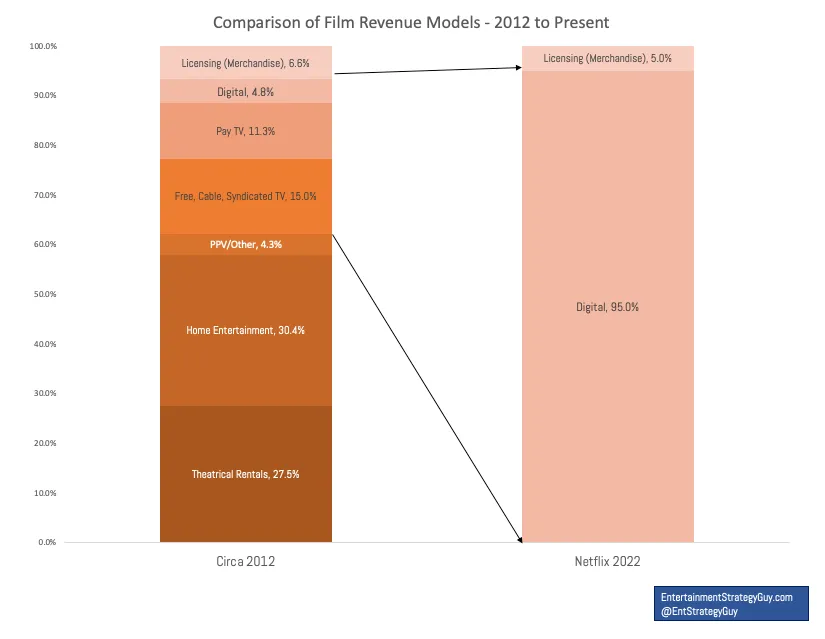
Big question #6: How do direct-to-streaming movies make money?
Quick answer: Streaming movies generate revenue through subscriptions/advertising or merchandise licensing. In contrast, a theatrical release uses multiple windows and revenue streams.
Big question #7: What are the biggest movie releases ever?
Top-grossing movies of all time according to Box Office Mojo:
1) Avatar (2009) – $2.9B
2) Avengers: Endgame (2019) – $2.8B
3) Avatar: The Way of Water (2022) – $2.3B
4) Titanic (1997) – $2.3B
5) Star Wars: Episode VII – The Force Awakens (2015) – $2.1B
6) Avengers: Infinity War (2018) – $2.1B
7) Spider-Man: No Way Home (2021) – $1.9B
8) Jurassic World (2015) – $1.7B
9) The Lion King (2019) – $1.7B
10) The Avengers (2012) – $1.5B
Wow: James Cameron accounts for 3 of the 4 highest-grossing films.
Bottom line: Since 2021, 6 movies have surpassed $1B at the box office. The smaller releases have become economically unviable at the box office.
% change between 2019-22:
1) Box office revenue – ↓ 35%
2) # of movies – ↓ 46%
3) Revenue/movie – ↑ 19%
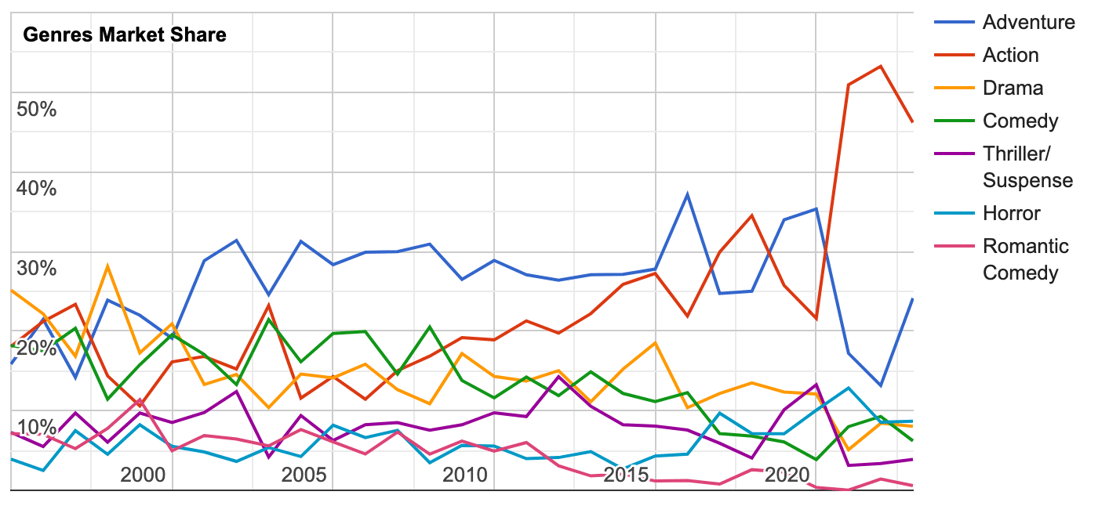
Big question #8: What genres generate the most box office revenue?
Quick answer: Action movies accounted for 53% of 2022 box office revenue.
Box office revenue share for action movies according to The Numbers:
1) 2002 – 15%
2) 2012 – 20%
3) 2022 – 53%