Six big questions re: how we watch video:
1) How much time do we spend searching for something to watch?
2) Did broadcast/cable gain ground on streaming?
3) Which streaming services account for the highest share of total TV?
4) Are younger consumers driving the growth in streaming’s share of total TV time?
5) Which platforms do younger consumers prefer?
6) What is the last thing we do before bed?
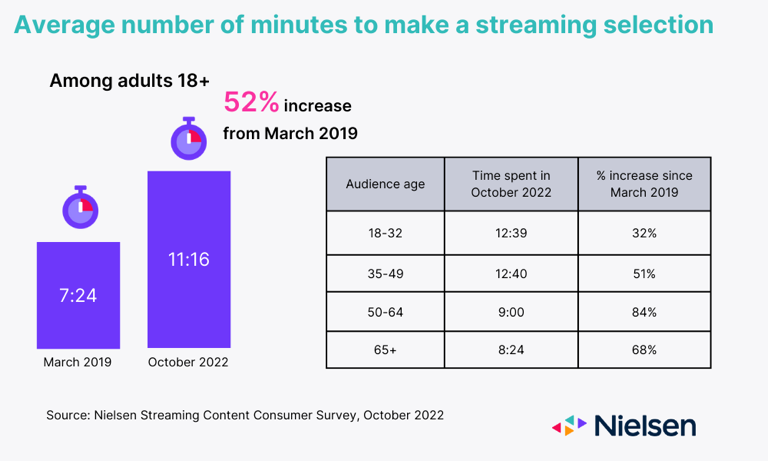
Big question #1: How much time do we spend searching for something to watch?
Quick answer: 11m 16s
Time spent making a streaming selection (% change) according to Nielsen:
1) 2019-Mar – 7m 24s
2) 2022-Oct – 11m 16s (↑ 52%)
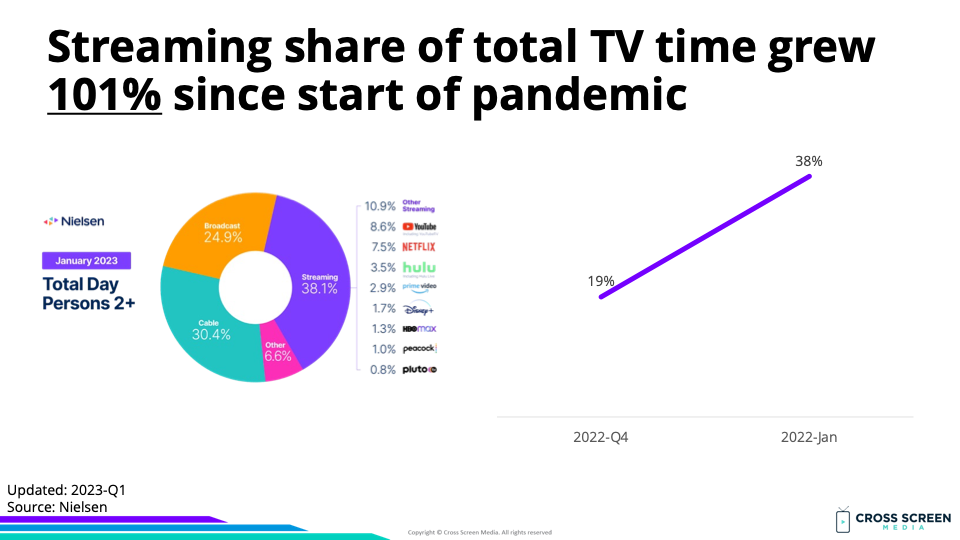
Big question #2: Did broadcast/cable gain ground on streaming?
Quick answer: No.
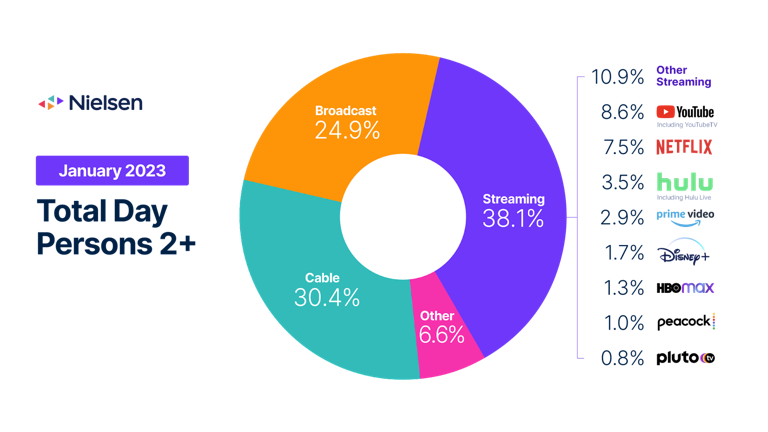
Share of total TV time according to Nielsen:
1) Streaming – 38%
2) Cable – 30%
3) Broadcast – 25%
4) Other – 7%
Streaming share of total TV time (YoY growth):
1) 2019-Q4 – 19%
2) 2022-Dec – 38% (↑ 101%)
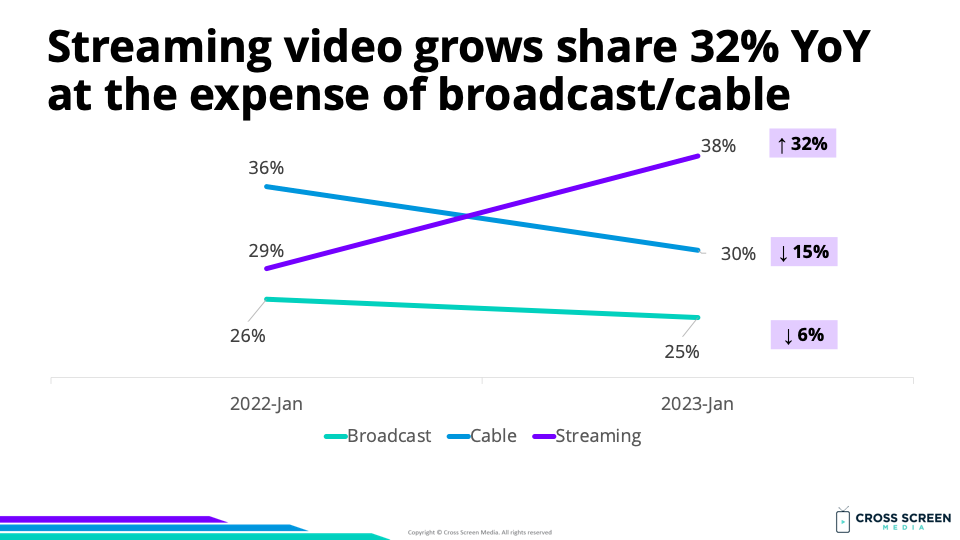
YoY change in total TV time:
1) Streaming – ↑ 32%
2) Broadcast – ↓ 6%
3) Cable – ↓ 15%
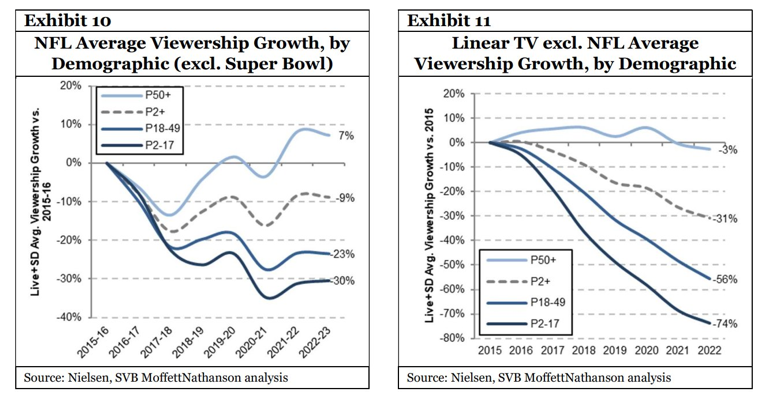
Viewership growth between 2015-22 for linear TV by age group according to Nielsen:
1) 50+ – ↓ 3%
2) 2+ – ↓ 31%
3) 18-49 – ↓ 56%
4) 2-17 – ↓ 74%
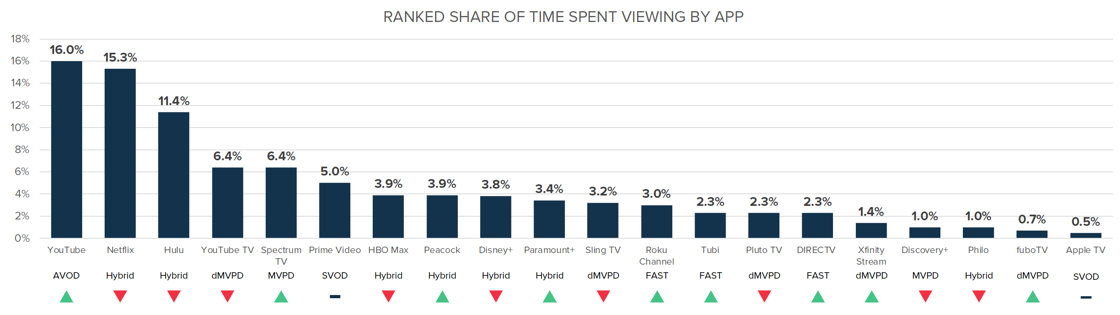
Big question #3: Which streaming services account for the highest share of total TV?
Share of total TV time (streaming only):
1) YouTube – 9%
2) Netflix – 8%
3) Hulu – 4%
4) Amazon Prime – 3%
5) Disney+ – 2%
6) HBO Max – 1%
7) PlutoTV – 1%
8) Peacock – 1%
9) Other – 11%
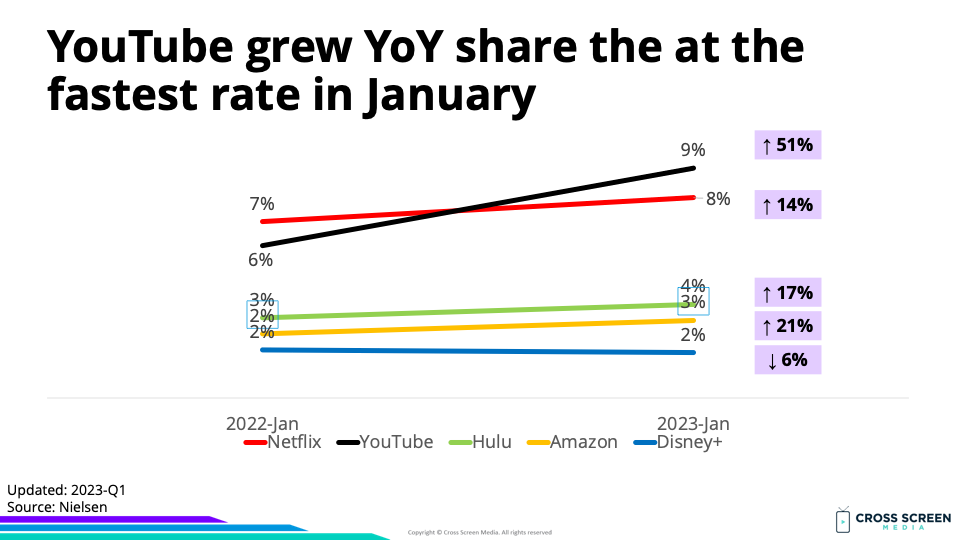
YoY growth rate for streaming:
1) YouTube – ↑ 51%
2) Amazon Prime – ↑ 21%
3) Hulu – ↑ 17%
4) Netflix – ↑ 14%
5) Disney+ – ↓ 6%
Deep dive: TVision released similar data, including smaller streaming services (< 1% of total TV time).
Big question #4: Are younger consumers driving the growth in streaming’s share of total TV time?
Quick answer: No!!! 55% of time spent with ad-supported streaming comes from 50+.
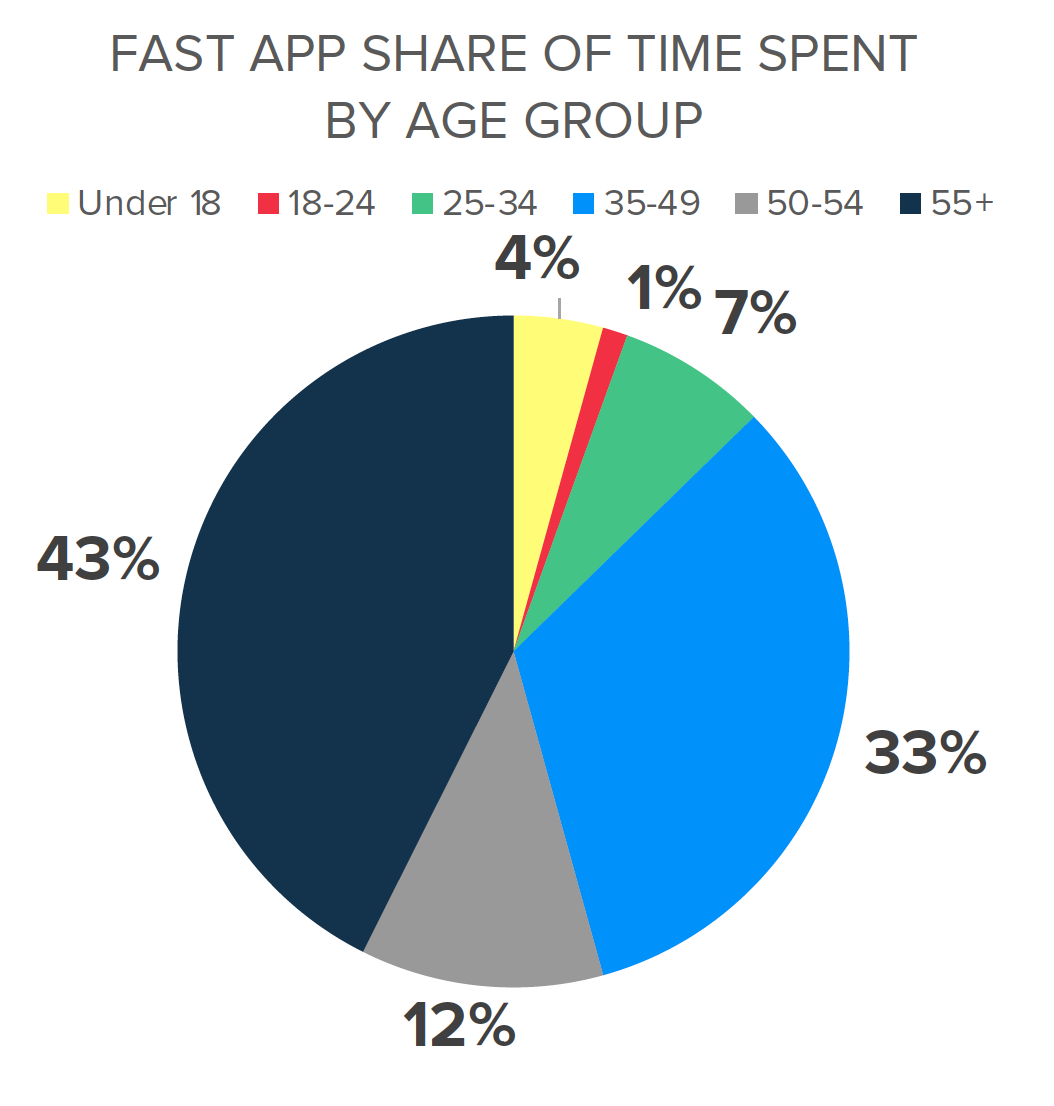
Spoiler alert: This group also accounts for the largest share of linear TV viewing. 🤔
Why this matters: Consumers in the 50+ demo are easy to reach with convergent TV advertising (linear or streaming) and dominate any frequency curve’s right side (over frequency). We must plan, activate and measure across screens to reach everyone else.
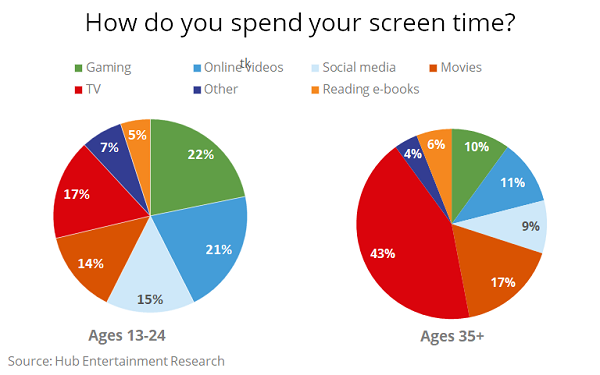
Big question #5: Which platforms do younger consumers prefer?
Share of screen time for 13-24 by platform according to Hub Entertainment Research:
1) Gaming – 22%
2) Non-premium video – 21%
3) TV – 17%
4) Social media – 15%
5) Movies – 14%
6) Reading e-books – 5%
7) Other – 7%
Quote from Jon Giegengack – Principal @ Hub Entertainment Research:
“The ‘streaming wars’ monopolize the spotlight when it comes to predicting the fortunes of media companies in the future. But this obscures an even more important shift: the next generation of TV consumers are just less engaged with traditional TV itself. Gaming and social video are the focus of their entertainment lifestyles. There’s no reason to assume they’ll grow out of these habits as they age. Media organizations need to adapt to these changes in order to meet tomorrow’s viewers on the devices and platforms where they will spend most of their time.”
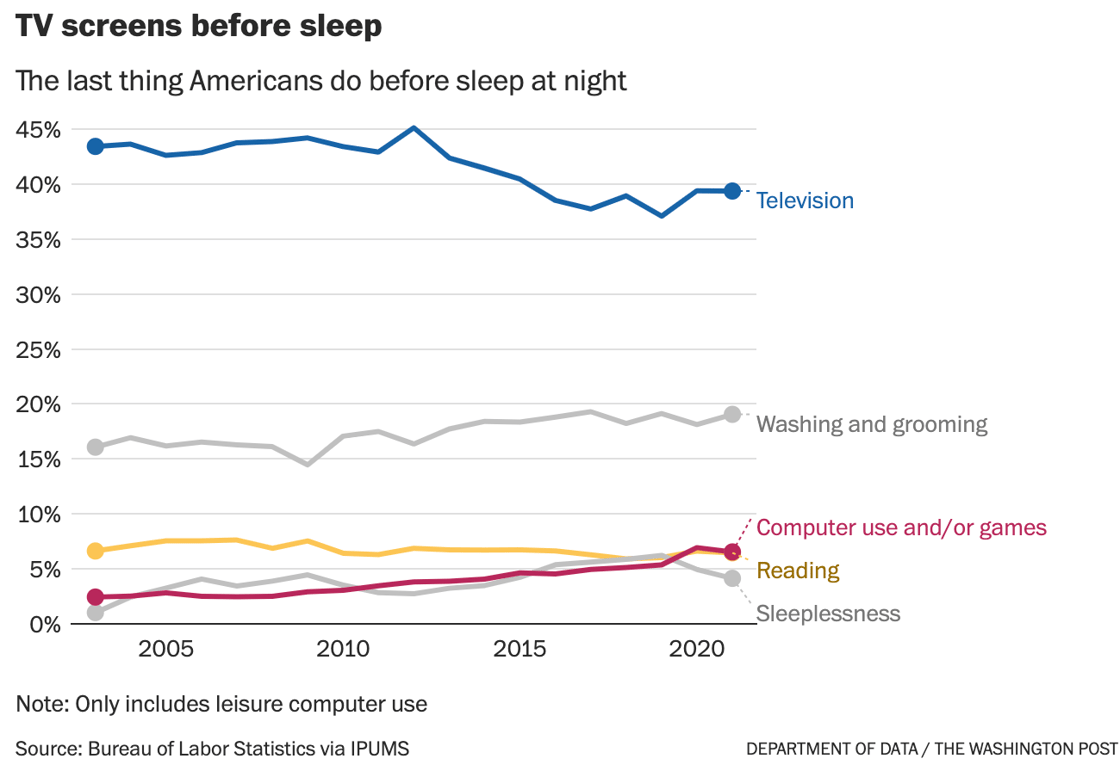
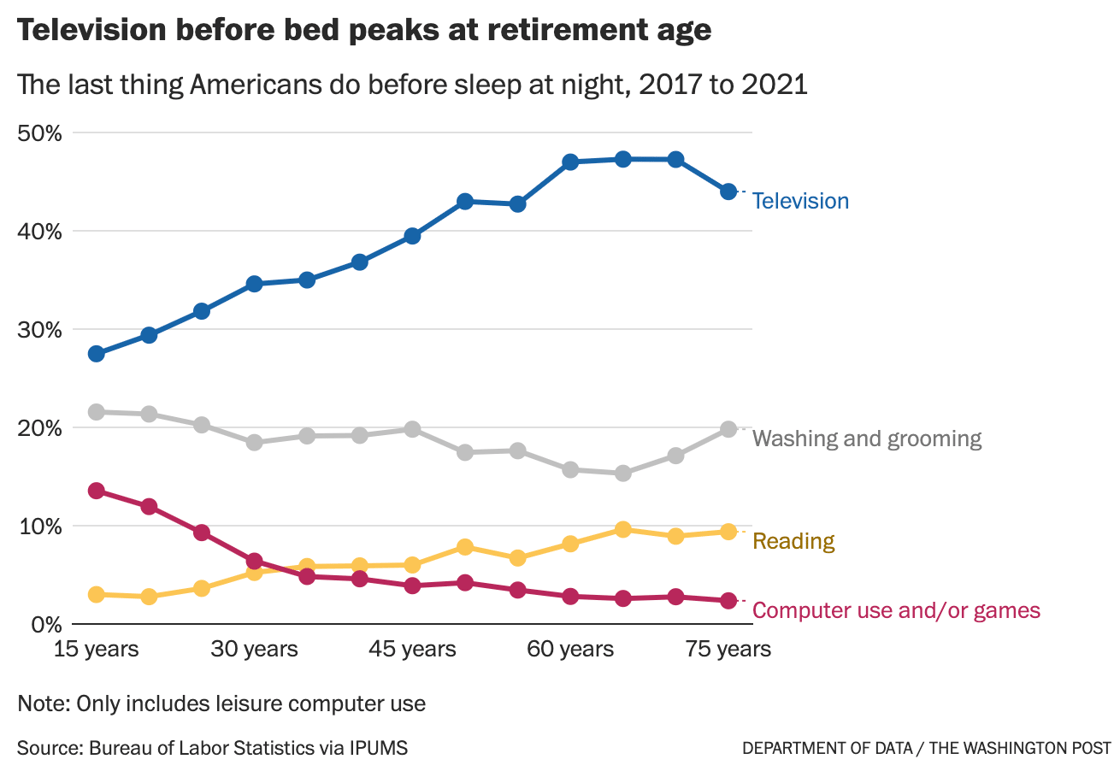
Big question #6: What is the last thing we do before bed?
Quick answer: 39% watch TV
Interesting: Watching TV before bed peaks in our 60s (47%).
 |

