Four big questions re: how we watch video:
1) Did football season decrease streaming’s share of total TV?
2) Which streaming services account for the highest share of total TV?
3) Which room in the house do we watch most of our TV?
4) Are we spending more time alone or with friends/family?
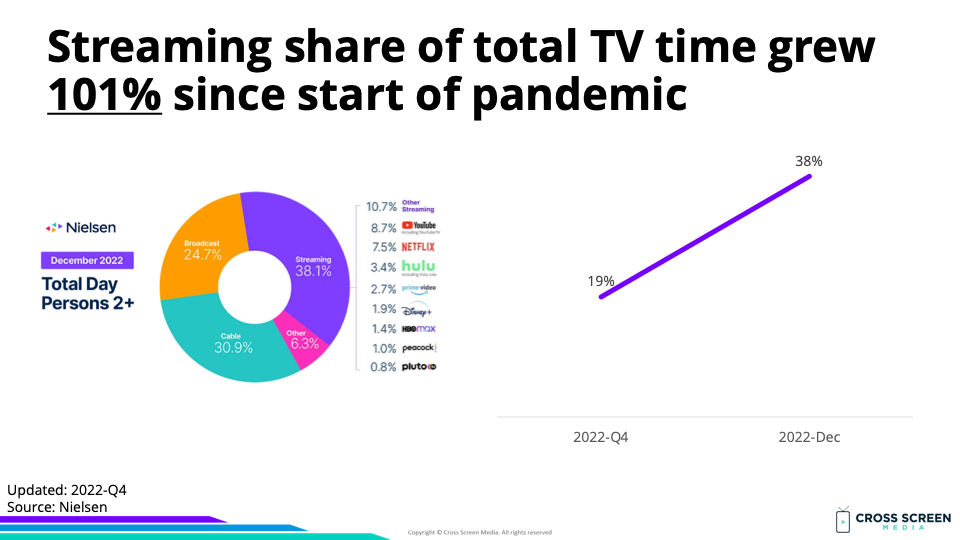
Big question #1: Did football season decrease streaming’s share of total TV?
Quick answer: No. Streaming grew its share to 38% from 35% in August.
Share of total TV time according to Nielsen:
1) Streaming – 38%
2) Cable – 31%
3) Broadcast – 25%
4) Other – 6%
Streaming share of total TV time (YoY growth):
1) 2019-Q4 – 19%
2) 2022-Dec – 38% (↑ 101%)
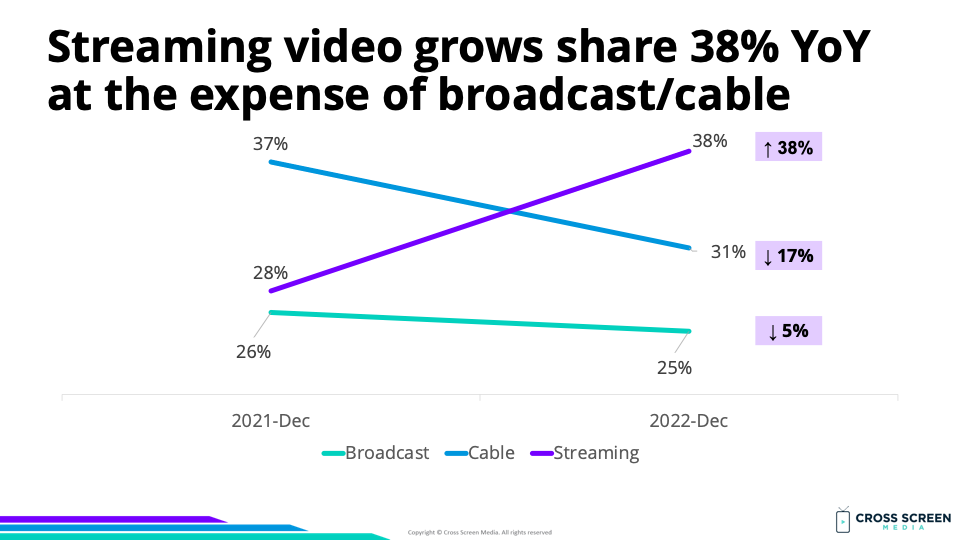
YoY change in total TV time:
1) Streaming – ↑ 38%
2) Broadcast – ↓ 5%
3) Cable – ↓ 17%
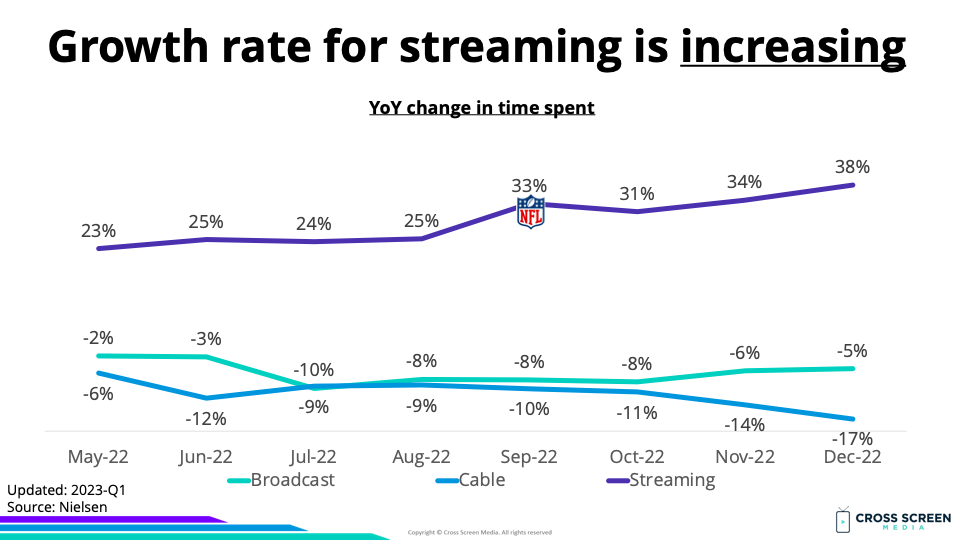
YoY growth rate for streaming:
1) May – ↑ 23%
2) June – ↑ 25%
3) July – ↑ 24%
4) August – ↑ 25%
5) September – ↑ 33%
6) October – ↑ 31%
7) November – ↑ 34%
8) December – ↑ 38%
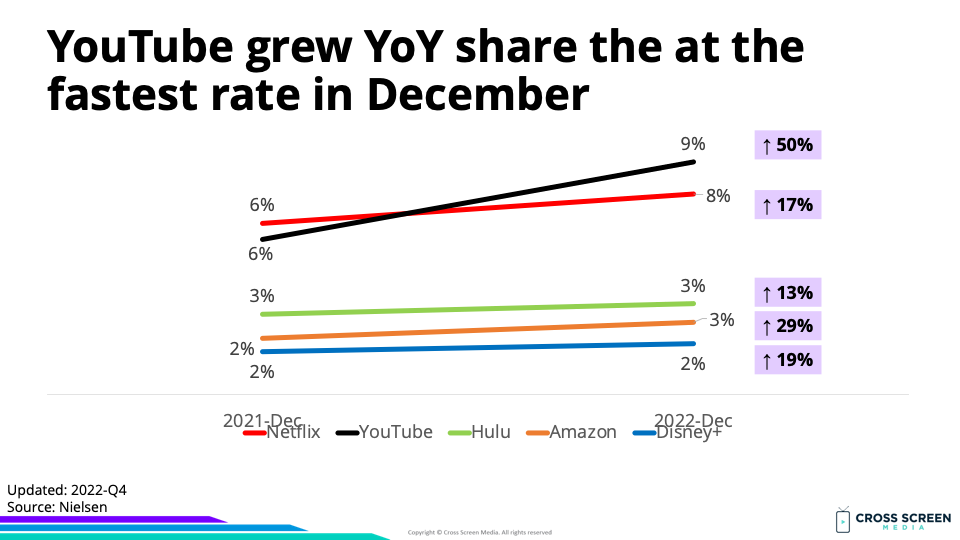
Big question #2: Which streaming services account for the highest share of total TV?
Share of total TV time (streaming only):
1) YouTube – 9%
2) Netflix – 8%
3) Hulu – 3%
4) Amazon Prime – 3%
5) Disney+ – 2%
6) HBO Max – 1%
7) PlutoTV – 1%
8) Peacock – 1%
9) Other – 11%
YoY growth rate for streaming:
1) YouTube – ↑ 50%
2) Amazon Prime – ↑ 29%
3) Disney+ – ↑ 19%
4) Netflix – ↑ 17%
5) Hulu – ↑ 13%
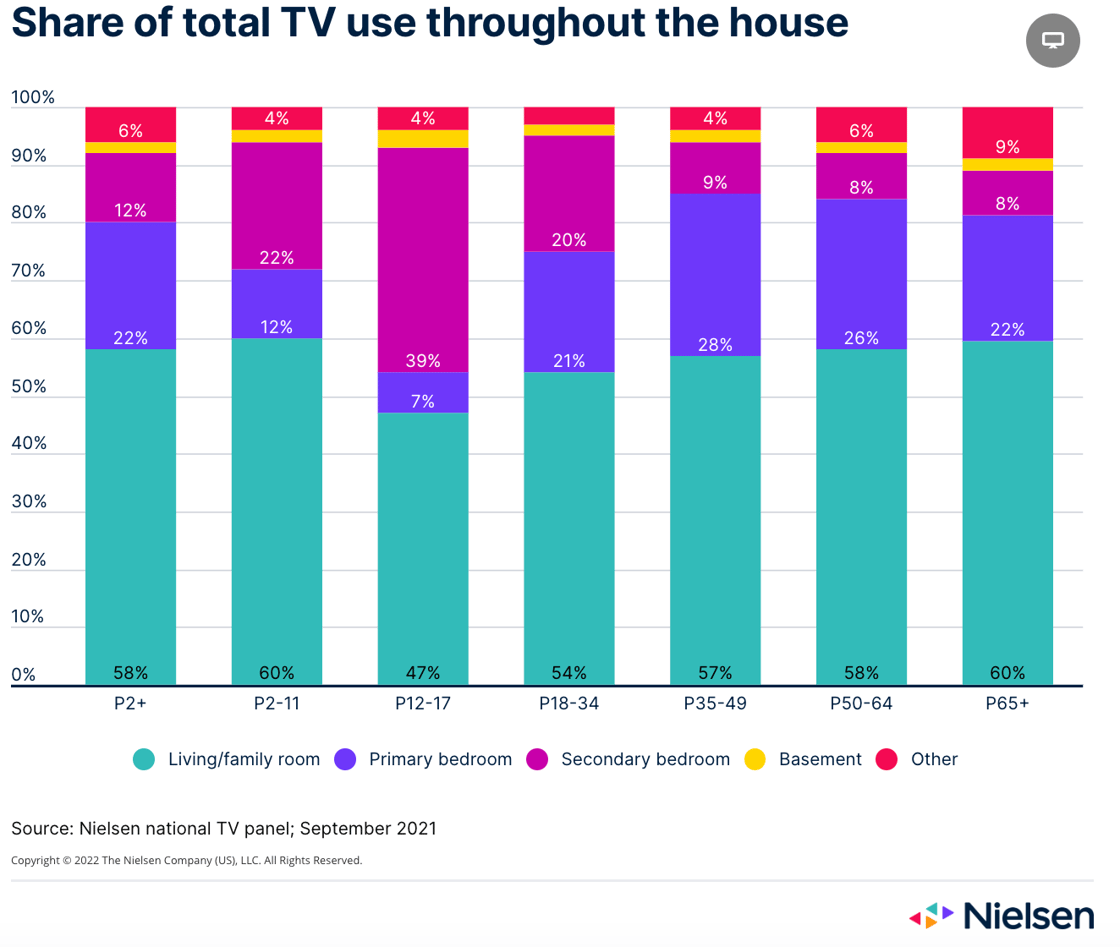
Big question #3: Which room in the house do we watch most of our TV?
Quick answer: The living room.
Share of total TV use by room according to Nielsen:
1) Living/family room – 58%
2) Primary bedroom – 22%
3) Secondary bedroom – 12%
4) Basement – 2%
5) Other – 6%
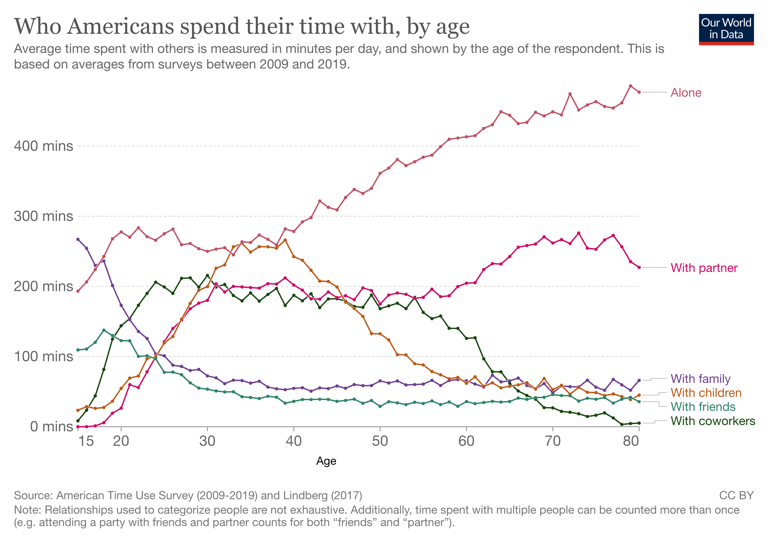
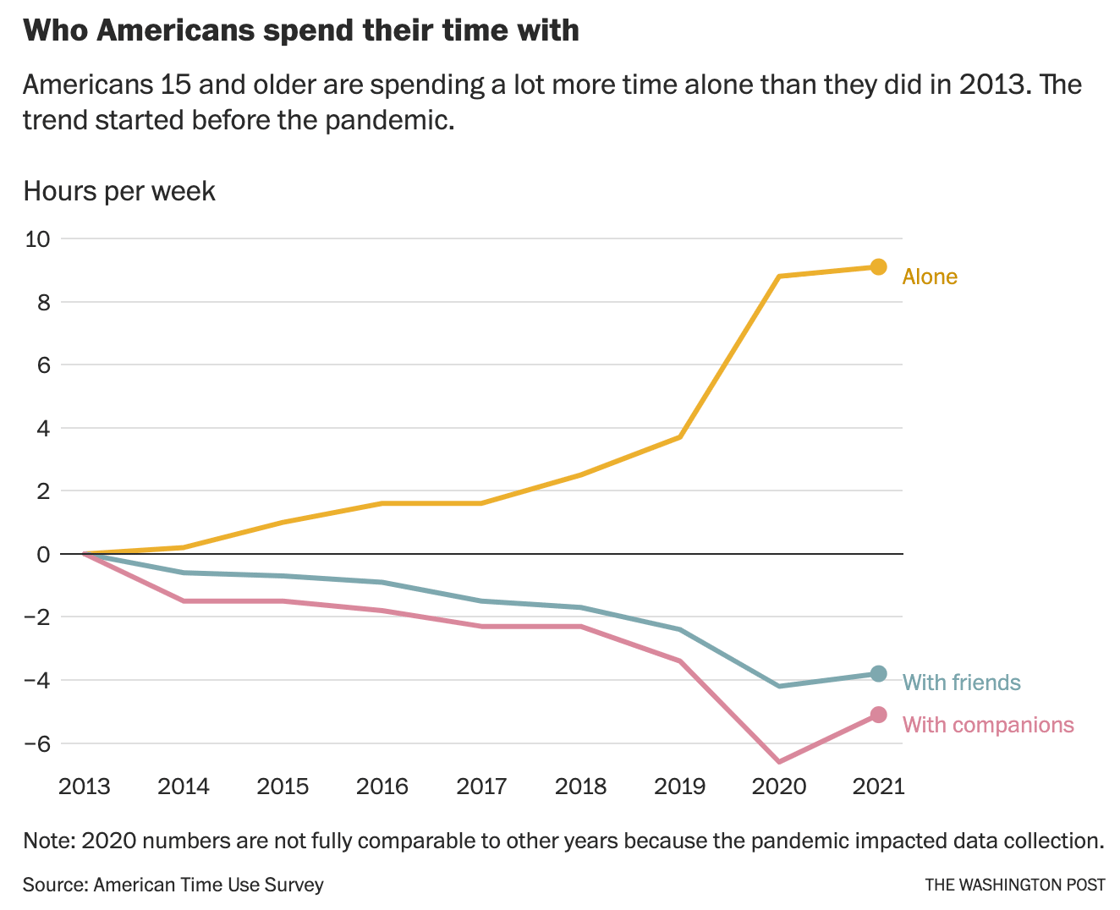
Big question #4: Are we spending more time alone or with friends/family?
Quick answer: Time spent alone has grown 16% (↑ 1 hour) since the pandemic’s start.
Minutes per day spent alone by age (% change) according to Visual Capitalist:
1) 20 – 278
2) 30 – 250 (↓ 10%)
3) 40 – 278 (↑ 11%)
4) 50 – 361 (↑ 30%)
5) 60 – 413 (↑ 14%)
6) 70 – 449 (↑ 9%)
7) 80 – 477 (↑ 6%)