
Screen Wars Thought Leader Interviews are also available on

SpotifyApple PodcastGoogle Podcast
State of the Screens

NBC Hopes the Olympics Help Peacock Take Flight

By July 29, 2021No Comments


PeacockOlympicGIF

Big news: The Olympics kicked off Friday, and NBCUniversal hopes for a boost in sign-ups for Peacock.

Summer Olympics (U.S. only) opening ceremony viewership (% change) according to Nielsen:
1) 1988 (Seoul) – 22.7M
2) 1992 (Barcelona) – 21.6M (↓ 5%)
3) 1996 (Atlanta) – 39.8M (↑ 84%)
4) 2000 (Sydney) – 27.3M (↓ 31%)
5) 2004 (Athens) – 25.4M (↓ 7%)
6) 2008 (Beijing) – 34.9M (↑ 37%)
7) 2012 (London) – 40.7M (↑ 17%)
8) 2016 (Rio) – 26.5M (↓ 35%)
9) 2020 (Tokyo) – 16.7M (↓ 37%)

Big question #1: What share of Americans plan to watch the Olympics?


Quick answer: 61% of adults plan on watching.

Summer Olympics (U.S. only) average primetime viewership (% change) according to NBC Sports:
1) 2000 (Sydney) – 21.5M
2) 2004 (Athens) – 24.9M (↑ 16%)
3) 2008 (Beijing) – 27.2M (↑ 9%)
4) 2012 (London) – 30.3M (↑ 11%)
5) 2016 (Rio) – 27.5M (↓ 9%)
6) 2020 (Tokyo) – ?

Big question #2: How do people plan on watching the Olympics?

Viewing method for Summer Olympics according to Amdocs:
1) Live cable/pay-TV – 43%
2) Streaming – 28%
3) Broadcast TV – 26%
4) Social media – 16%
5) On-demand – 15%

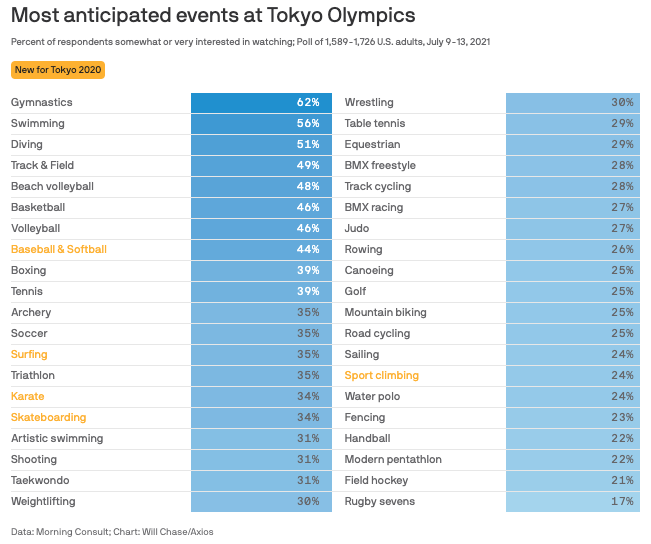
Big question #3: What are the most anticipated sports?

Most anticipated sports at Summer Olympics according to Morning Consult:
1) Gymnastics – 62%
2) Swimming – 56%
3) Diving – 51%
4) Track & Field – 49%
5) Beach Volleyball – 48%
6) Basketball – 46%
7) Volleyball – 46%
8) Baseball & Softball – 44%
9) Boxing – 39%
10) Tennis – 39%

2021-07-28_15-27-52

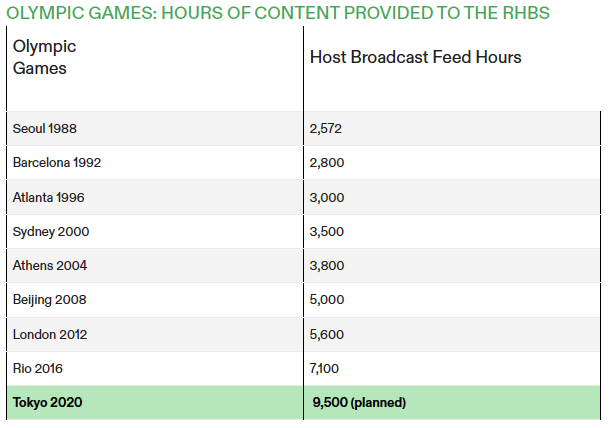
Big question #4: How much does NBCUniversal currently pay to air the Olympics?

Quick answer: $1.1B for the 2020 games

Big question #5: How many hours of content will be generated during the Summer Olympics?

Summer Olympics hours of content (% change) according to the International Olympic Committee:
1) 1988 (Seoul) – 2,572
2) 1992 (Barcelona) – 2,800 (↑ 9%)
3) 1996 (Atlanta) – 3,000 (↑ 7%)
4) 2000 (Sydney) – 3,500 (↑ 17%)
5) 2004 (Athens) – 3,800 (↑ 9%)
6) 2008 (Beijing) – 5,000 (↑ 32%)
7) 2012 (London) – 5,600 (↑ 12%)
8) 2016 (Rio) – 7,100 (↑ 27%)
9) 2020 (Tokyo) – 9,500 (↑ 34%)

34J2.1-1A

Big question #6: What potential impact could the Olympics have on Peacock?

Quick answer: 30% increase in sign-ups.

Peacock user status (% of total) according to Bloomberg:
1) Non-active sign-ups – 28M (67%)
2) Free tier monthly user (MAU) – 11M (26%)
3) Pay tier monthly user (MAU) – 3M (7%)
4) Total sign-ups – 42M

Michael Beach

Michael Beach is the Chief Executive Officer of Cross Screen Media, a media analytics and software company that enables marketers to plan, activate, and measure CTV and linear TV at the local level. Michael is also the founder and editor of State of the Screens, a weekly newsletter focused on video advertising that is a must-read for thought leaders in the advertising industry. He has appeared in such publications as PBS Frontline, The Wall Street Journal, The New York Times, Axios, CNBC and Bloomberg, and on NPR’s Planet Money podcast.

Leave a Reply