Five big questions re: peak TV:
1) How many TV shows were released last year?
2) How much is spent on TV content each year?
3) Which streaming services are turning a profit?
4) What share of TV show production is international?
5) When does viewership for a TV show taper off?
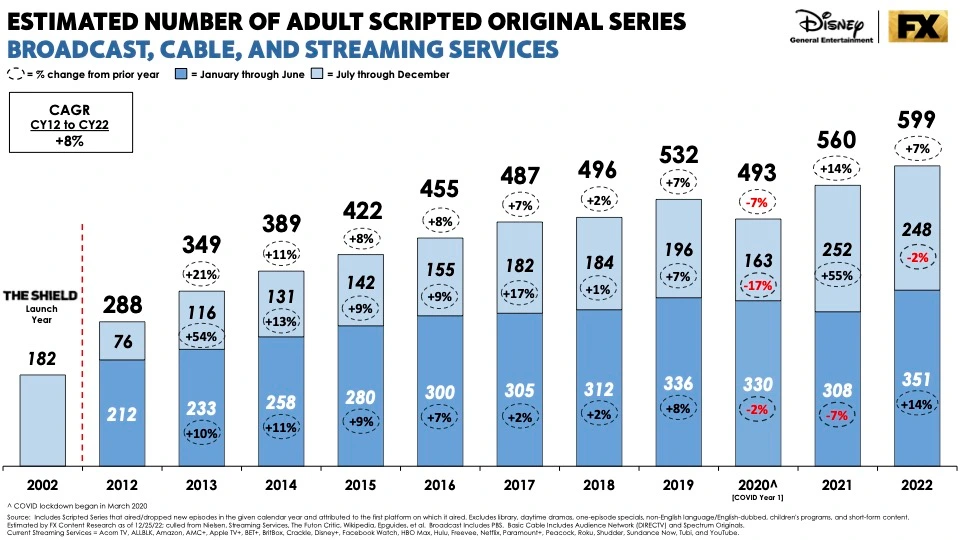
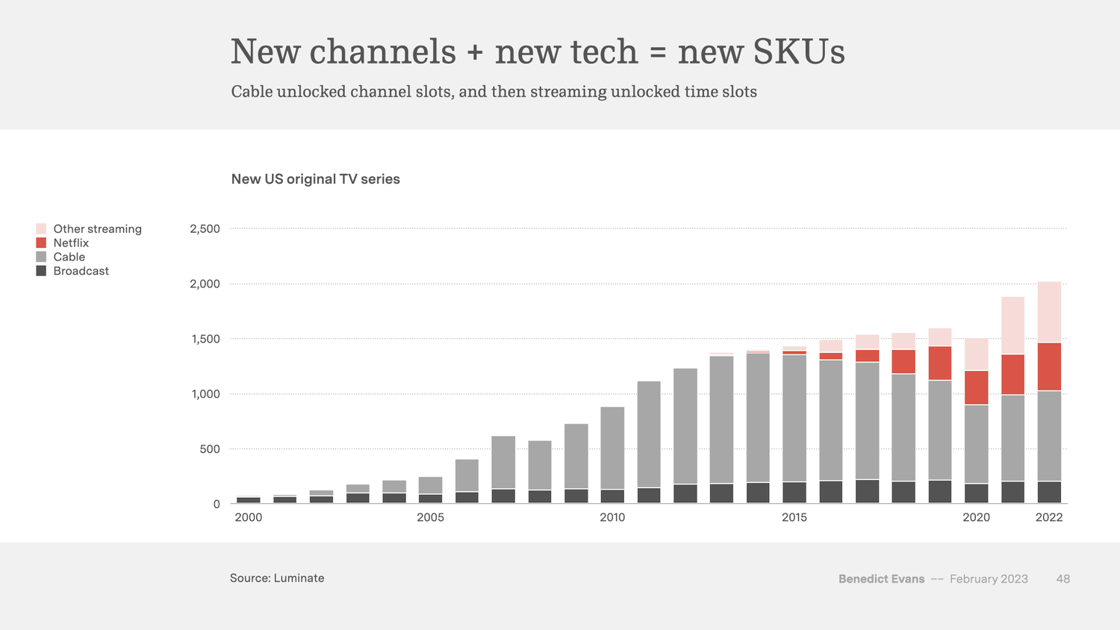
Big question #1: How many TV shows were released last year?
Original scripted shows (YoY growth) according to FX:
1) 2013 – 349 (↑ 21%)
2) 2014 – 389 (↑ 11%)
3) 2015 – 422 (↑ 8%)
4) 2016 – 455 (↑ 8%)
5) 2017 – 487 (↑ 7%)
6) 2018 – 495 (↑ 2%)
7) 2019 – 532 (↑ 7%)
8) 2020 – 493 (↓ 7%)
9) 2021 – 559 (↑ 13%)
10) 2022 – 599 (↑ 7%)
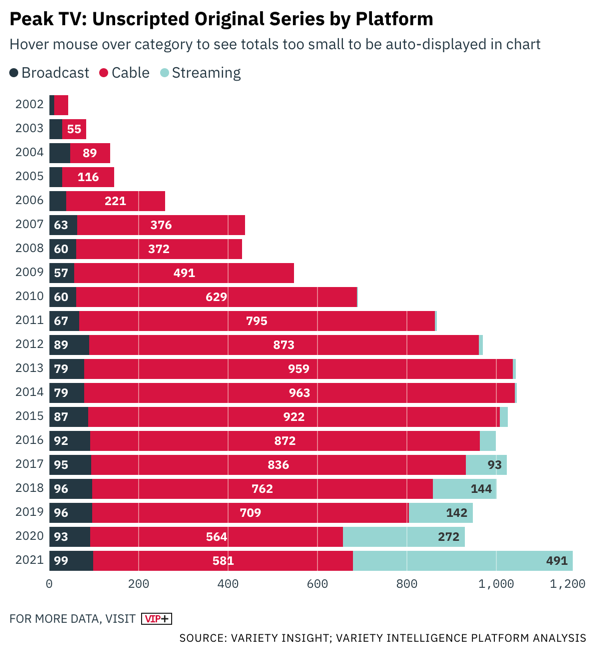
Next big thing: The streaming players are dusting off TV’s playbook from the early 2000s (Survivor, Big Brother, etc.). According to Variety, unscripted programming will add 1,172 series to the numbers above! Streaming accounted for 42% of all unscripted series in 2021 vs. less than 4% five years prior (2016).
Original unscripted shows, according to Matthew Ball:
1) 2002 – 50
2) 2023 – 1,100
Big question #2: How much is spent on TV content each year?
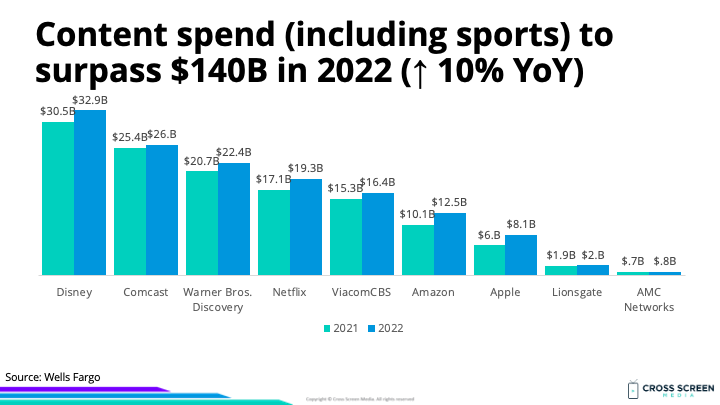
Peak TV is expensive: Producing all this new content will cost ≈ $140B (including sports rights) for the U.S. market and ≈ $233B globally this year alone.
Estimated U.S. content spend by network (YoY growth) in 2022 according to Wells Fargo:
1) Disney – $33B (↑ 8%)
2) Comcast – $26B (↑ 2%)
3) Warner Bros. Discovery – $22B (↑ 8%)
4) Netflix – $19B (↑ 13%)
5) ViacomCBS – $16B (↑ 7%)
6) Amazon – $13B (↑ 24%)
7) Apple – $8B (↑ 35%)
8) Lionsgate – $2B (↑ 5%)
9) AMC Networks – $800M (↑ 4%)
10) Total – $140B (↑ 10%)
Wow: Netflix makes more shows than the entire TV industry did in 2006, the year before it launched streaming.
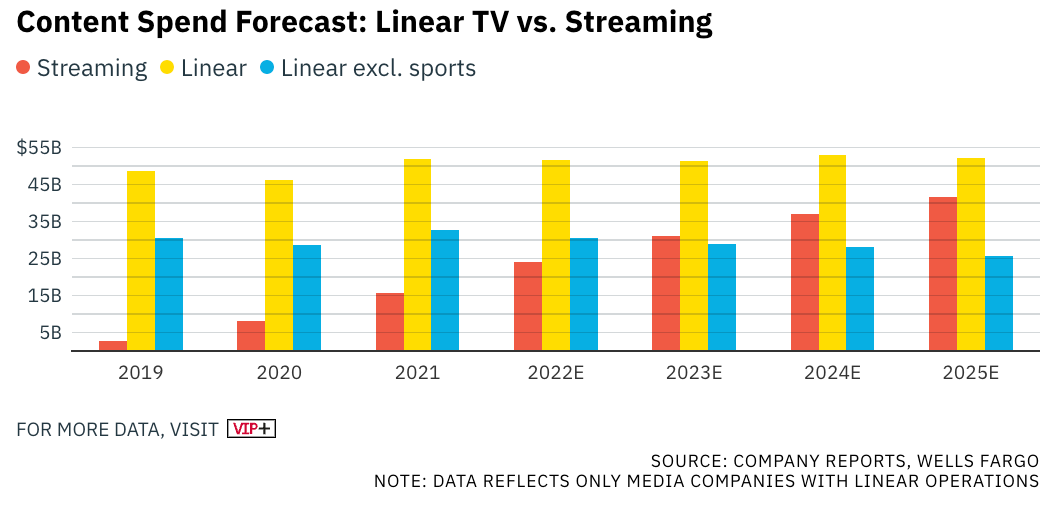
Estimated share of U.S. content spend by type in 2022 according to Wells Fargo:
1) Linear (no sports) – 41%
2) Streaming – 32%
3) Linear (sports) – 28%
Big question #3: Which streaming services are turning a profit?
Quick answer: Netflix.
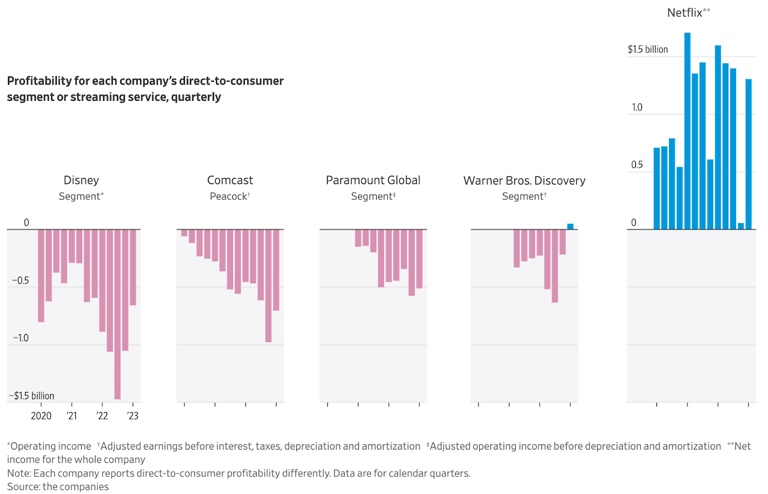
Quote from Jennifer Maas – Writer @ Variety:
“The phrase “Peak TV” emerged around 2015 as a description of television’s endless appetite for original series. Now, there’s one thing that writers and their estranged employers agree on: Peak TV has peaked. The talent pool has been stretched beyond its breaking point, and so have most of Hollywood’s balance sheets. The entertainment industry in aggregate can’t afford to keep producing content at the pace of recent years, as evidenced by the astounding financial losses reported and cost-cutting campaigns underway at Disney, Warner Bros. Discovery, Paramount Global and to a lesser degree Comcast.”
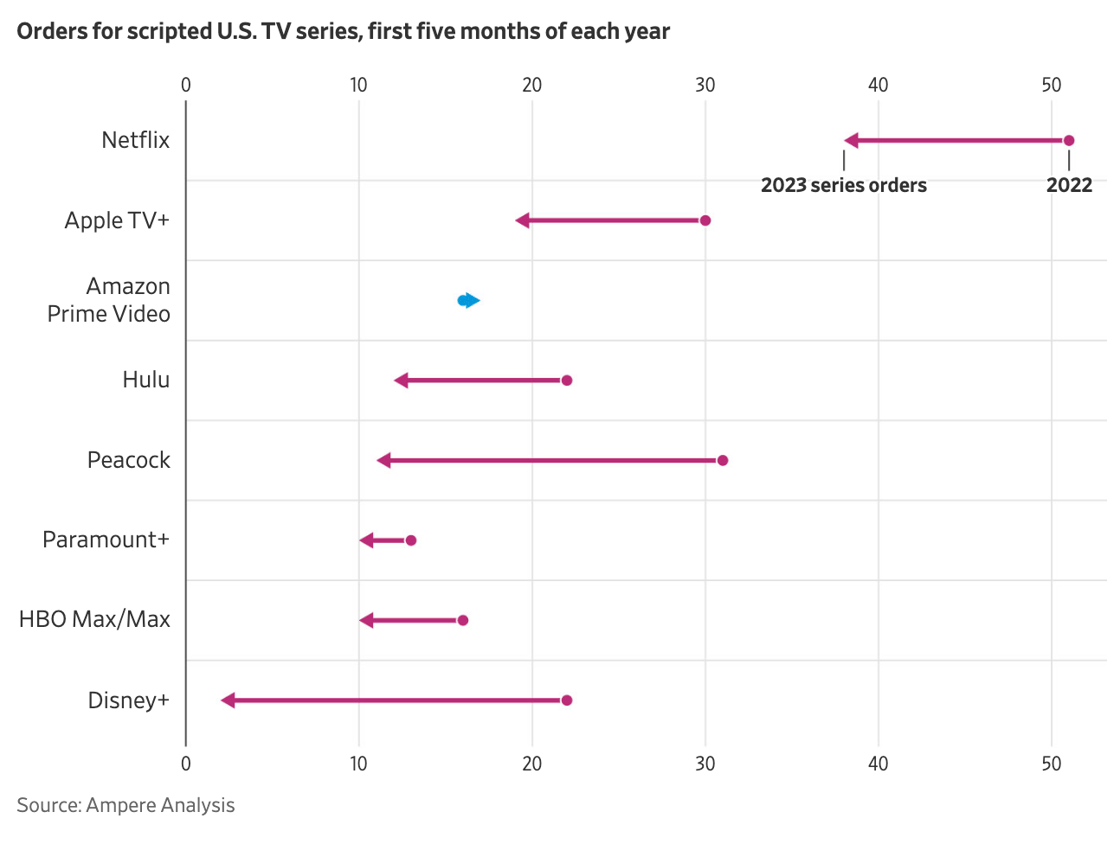
Bottom line: Everyone, including Netflix, is cutting back on the number of new TV shows.
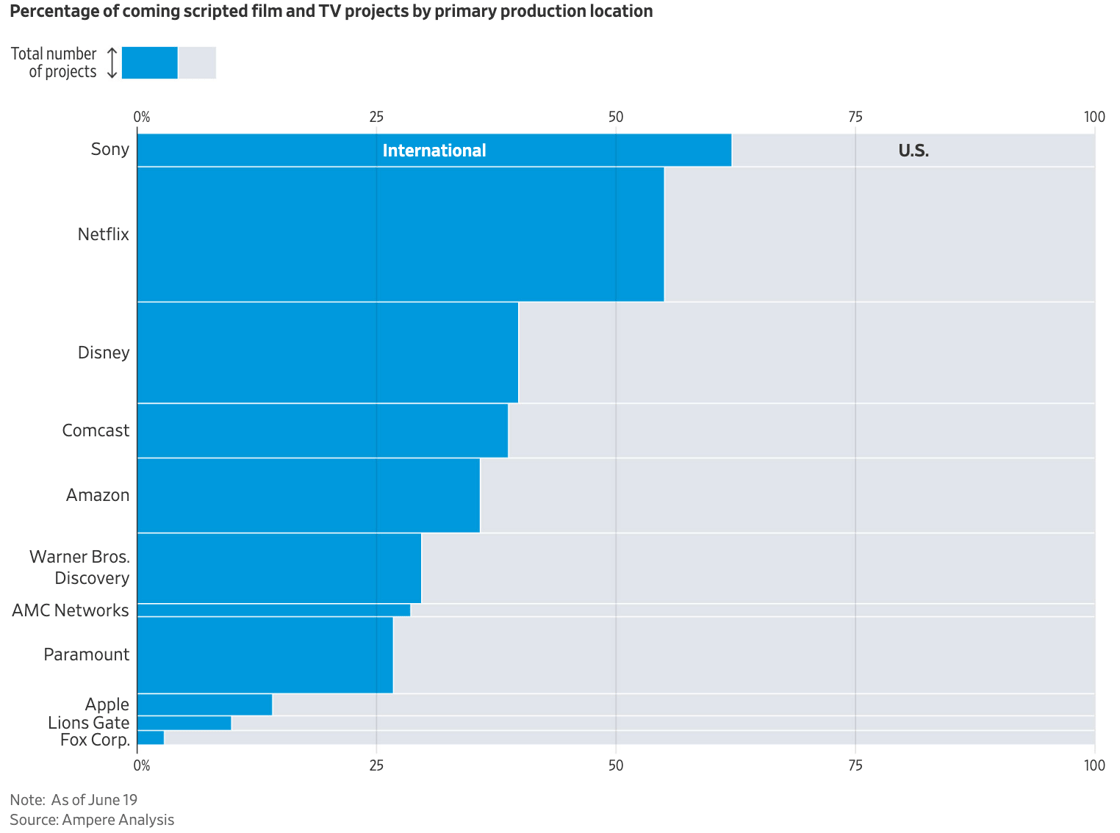
Big question #4: What share of TV show production is international?
Quick answer: Less than 50% outside Sony and Netflix.
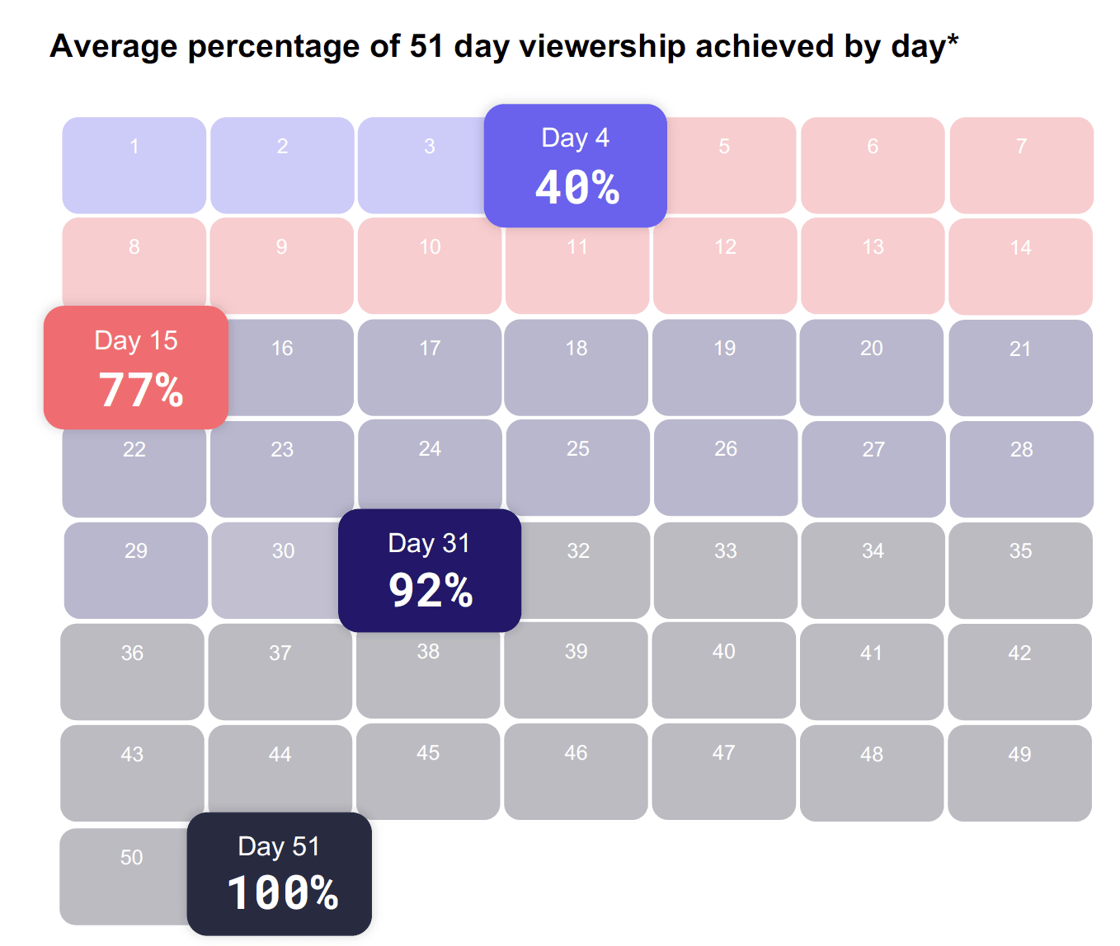
Big question #5: When does viewership for a TV show taper off?
Share of total episode viewership by day according to Samba TV:
1) Day 4 – 40%
2) Day 15 – 77%
3) Day 31 – 92%
4) Day 51 – 100%