4 big questions re: how we watch video:
1) Did the arrival of football season decrease streaming’s share of total TV?
2) Which streaming services account for the highest share of total TV?
3) What share of households use pay-TV as their default source for TV?
4) How many total TV households are in the United States?
Big question #1: Did the arrival of football season decrease streaming’s share of total TV?
Quick answer: No. In September, streaming grew at its fastest rate since Nielsen launched the Gauge in May 2021.
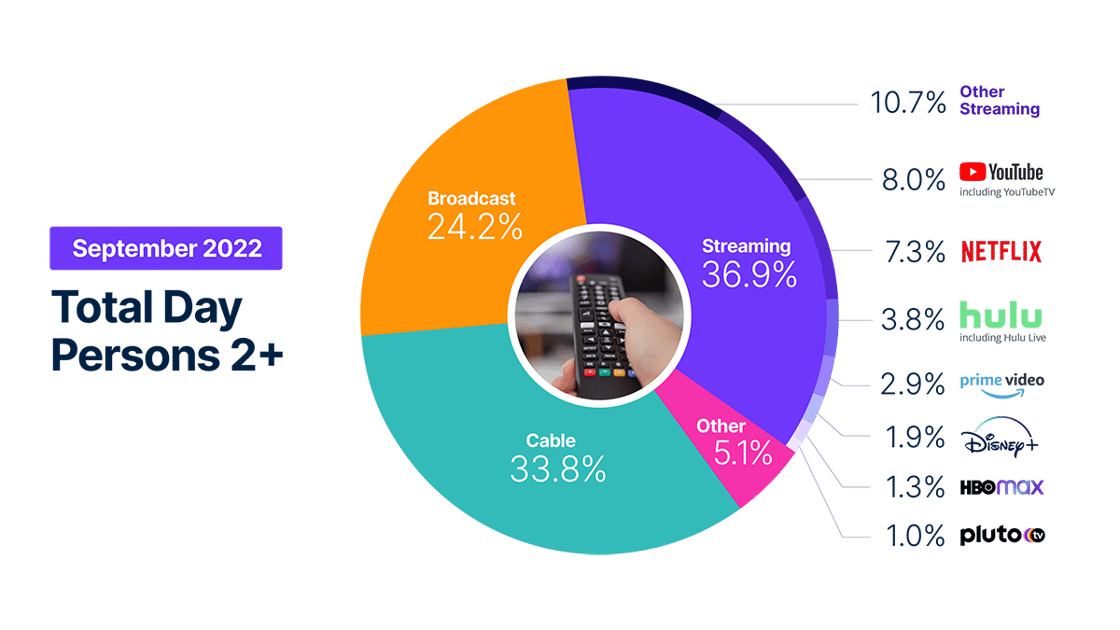
Share of total TV time according to Nielsen:
1) Streaming – 37%
2) Cable – 34%
3) Broadcast – 24%
4) Other – 5%
Why this matters: Linear TV experienced a boost from football’s return, but streaming still gained share.
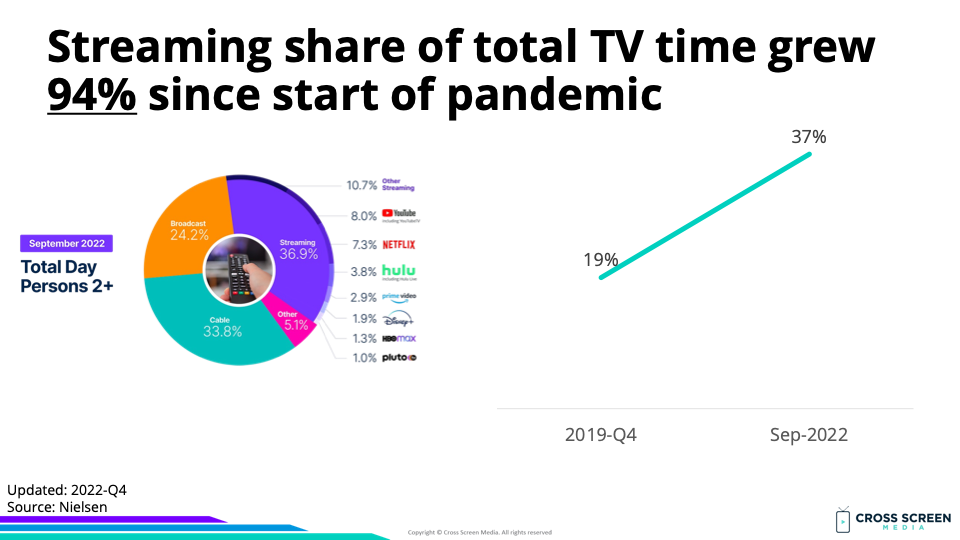
Streaming share of total TV time (YoY growth):
1) 2019-Q4 – 19%
2) 2022-Sep – 37% (↑ 94%)
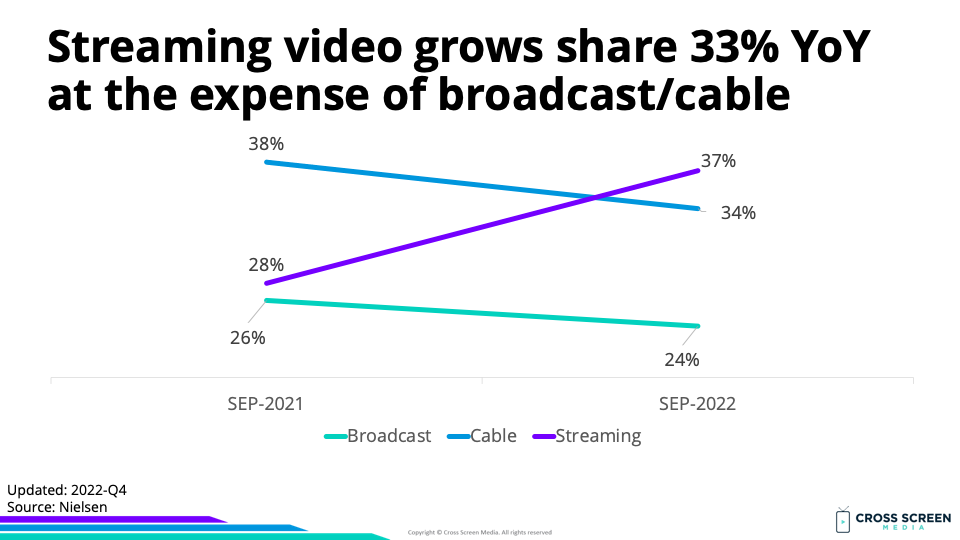
YoY change in total TV time:
1) Streaming – ↑ 33%
2) Broadcast – ↓ 8%
3) Cable – ↓ 10%
YoY growth rate for streaming:
1) May – ↑ 23%
2) June – ↑ 25%
3) July – ↑ 24%
4) August – ↑ 25%
5) September – ↑ 33%
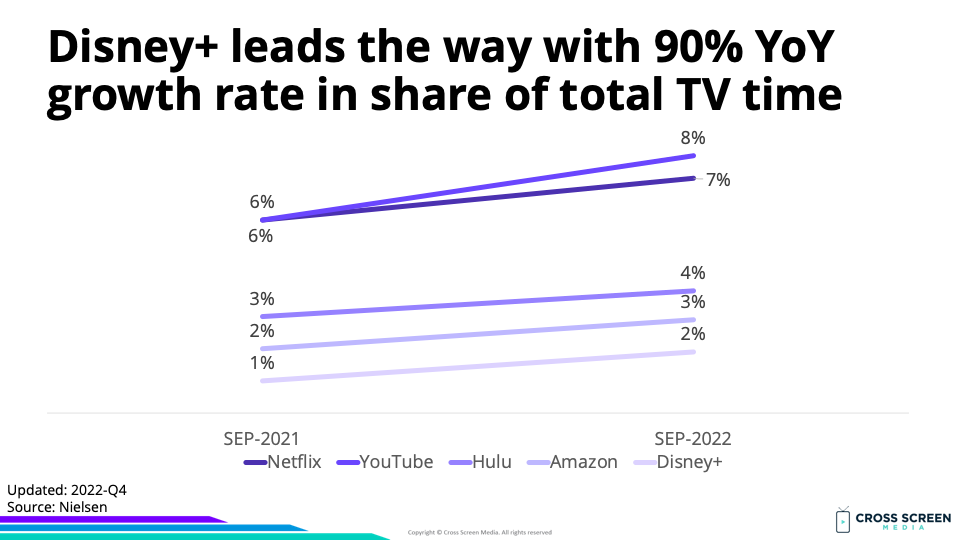
Big question #2: Which streaming services account for the highest share of total TV?
Share of total TV time (streaming only):
1) YouTube – 8%
2) Netflix – 7%
3) Hulu – 4%
4) Amazon Prime – 3%
5) Disney+ – 2%
6) HBO Max – 1%
7) PlutoTV – 1%
8) Other – 11%
YoY growth rate for streaming:
1) Disney+ – ↑ 90%
2) Amazon Prime – ↑ 45%
3) YouTube – ↑ 33%
4) Hulu – ↑ 27%
5) Netflix – ↑ 22%
Big question #3: What share of households use pay-TV as their default source for TV?
Share of consumers using pay-TV as their default source for watching TV according to Hub Entertainment Research:
1) 2019 – 39%
2) 2020 – 36%
3) 2021 – 35%
4) 2022 – 32%
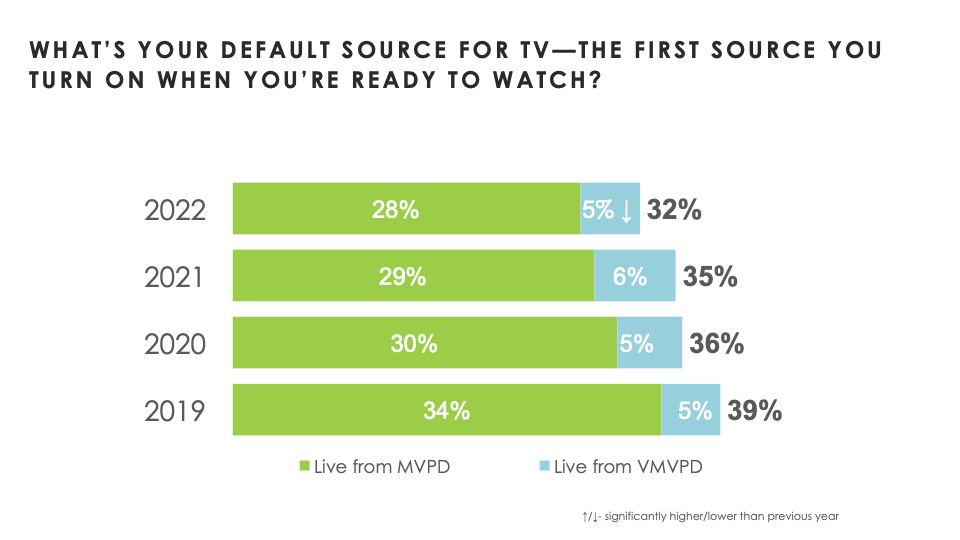
Why this matters: As cord-cutting increases, pay-TV will lose share of total TV time.
Big question #4: How many total TV households are in the United States?
Total TV households (% change) according to Nielsen:
1) 2002-03 – 106.7M
2) 2012-13 – 114.2M (↑ 7%)
3) 2022-23 – 123.8M (↑ 8%)
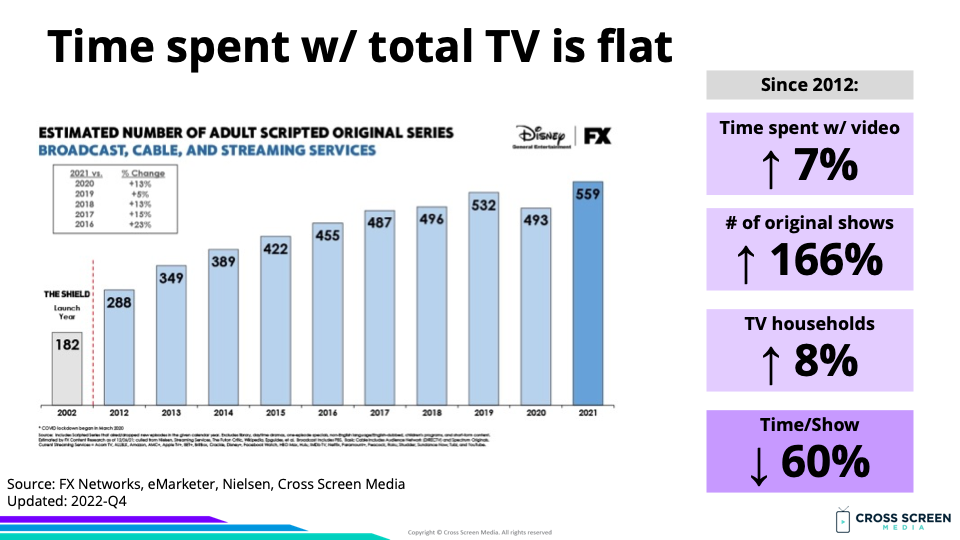
Bottom line: We discussed this topic at the recent 4As Stratfest conference. Since 2012, both time spent with video and new TV household creation has been ≈ 1% per year. Any share of total TV time moving to streaming comes directly from time spent with linear TV. This is zero-sum.
Quick math for change in attention available for the average show since 2012:
1) Time spent w/ video – ↑ 7%
2) # of original shows – ↑ 166%
3) TV households – ↑ 8%
4) Average time/show – ↓ 60%