Eight big questions re: cord cutting:
1) How do Americans receive television?
2) How many homes currently subscribe to a pay-TV bundle?
3) What share pay-TV subscriptions are streaming?
4) How large is the pay-TV market?
5) How does the broadband market compare to pay-TV?
6) Why is total pay-TV revenue not declining at the same rate as subscribers?
7) Which demographic groups are more likely to keep pay-TV?
8) What types of content are valued most in the pay-TV bundle?
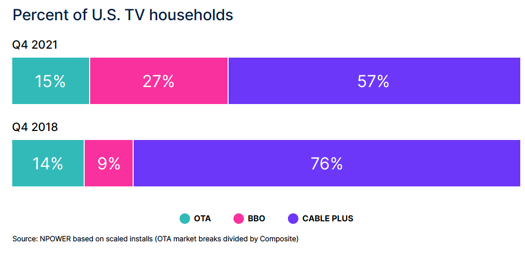
Big question #1: How do Americans receive television?
Share of U.S. TV households by source according to Nielsen:
1) Traditional pay-TV – 57%
2) Broadband-only – 27%
3) Antenna (OTA) – 15%
Big question #2: How many homes currently subscribe to a pay-TV bundle?
Quick answer: 78.1M
YoY change in pay-TV subscribers:
1) Traditional pay-TV – ↓ 5.7M
2) Streaming pay-TV – ↑ 1.9M
3) Total pay-TV – ↓ 3.8M
Total pay-TV subscriptions (YoY growth):
1) 2019-Q2 – 91.0M
2) 2020-Q2 – 85.9M (↓ 6%)
3) 2021-Q2 – 82.5M (↓ 5%)
4) 2022-Q2 – 78.1M (↓ 5%)
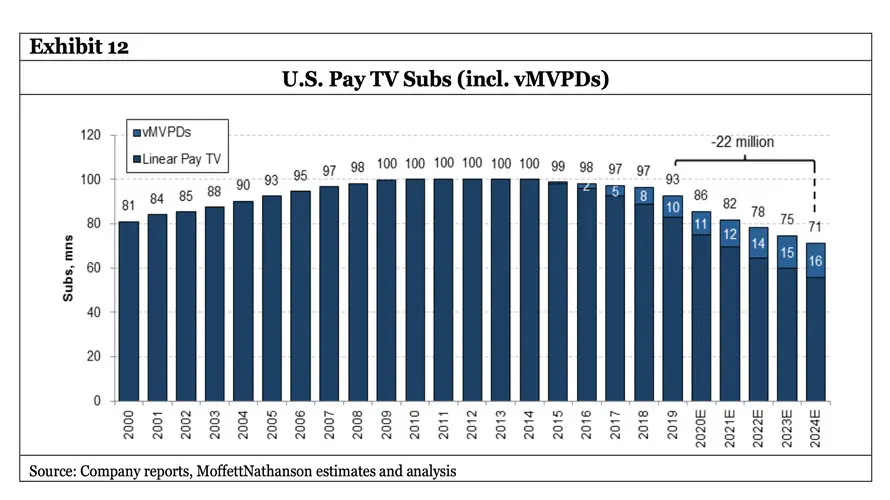
Big question #3: What share pay-TV subscriptions are streaming?
Quick answer: 17%
Streaming pay-TV subscriptions (YoY growth):
1) 2019-Q2 – 8.2M
2) 2020-Q2 – 9.9M (↑ 20%)
3) 2021-Q2 – 11.7M (↑ 18%)
4) 2022-Q2 – 13.0M (↑ 17%)
Streaming share of pay-TV subscribers:
1) 2019-Q2 – 9%
2) 2020-Q2 – 12%
3) 2021-Q2 – 14%
4) 2022-Q2 – 17%
Traditional pay-TV subscriptions (YoY growth):
1) 2019-Q2 – 82.8M
2) 2020-Q2- 76.0M (↓ 8%)
3) 2021-Q2 – 70.7M (↓ 7%)
4) 2022-Q2 – 65.0M (↓ 8%)
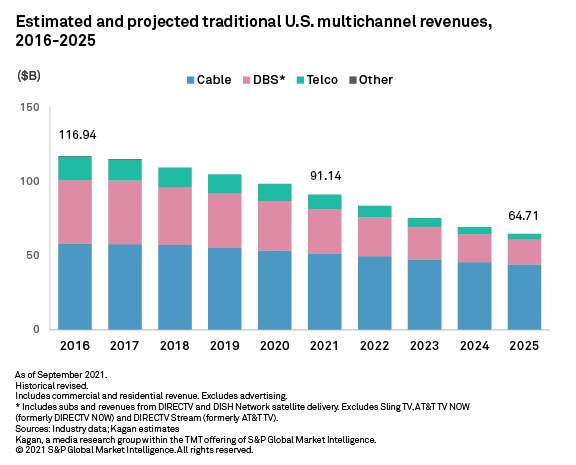
Big question #4: How large is the pay-TV market?
U.S. pay-TV revenue from subscriptions (% change) according to Kagan:
1) 2016 – $117B
2) 2021 – $91B (↓ 22%)
3) 2025 – $65B (↓ 29%)
Big question #5: How does the broadband market compare to pay-TV?
Quick answer: Broadband service is now a larger (and growing) business for companies such as Charter and Comcast.
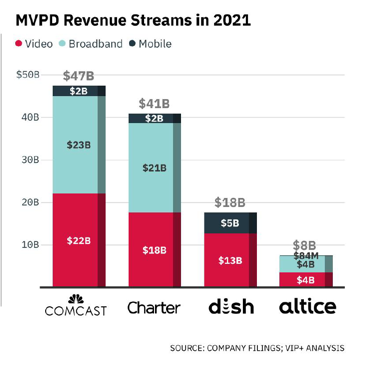
Total broadband subscriptions (YoY growth):
1) 2019-Q2 – 100.0M
2) 2020-Q2 – 103.4M (↑ 3%)
3) 2021-Q2 – 107.4M (↑ 4%)
4) 2022-Q2 – 108.7M (↑ 1%)
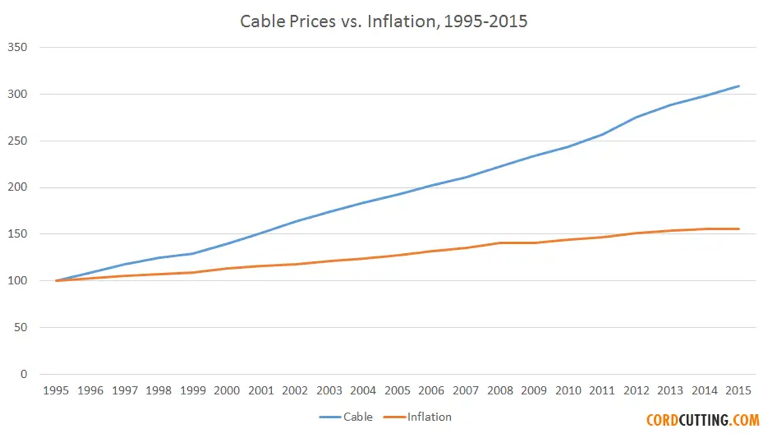
Big question #6: Why is total pay-TV revenue not declining at the same rate as subscribers?
Quick answer: As inflation and cancellations have increased, pay-TV prices have risen faster.
Annual price change between 1995-2015, according to CordCutting.com:
1) Pay-TV – ↑ 6%
2) Inflation – ↑ 2%
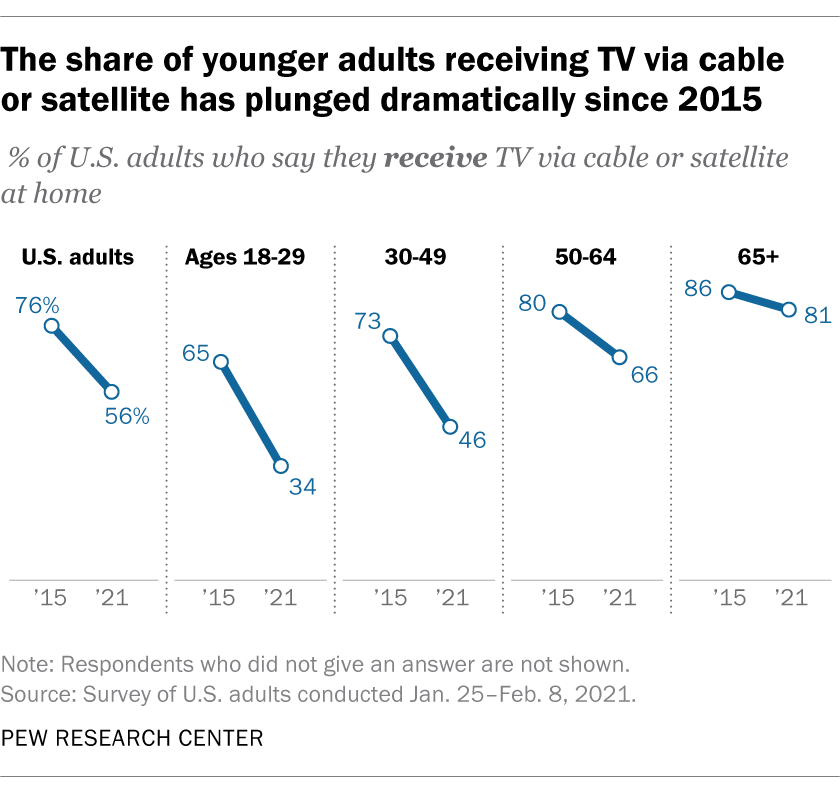
Big question #7: Which demographic groups are more likely to keep pay-TV?
Share of adults that forgo traditional pay-TV according to Pew:
1) 18-29 – 66%
2) 30-49 – 54%
3) 18+ – 44%
4) 50-64 – 34%
5) 65+ – 19%
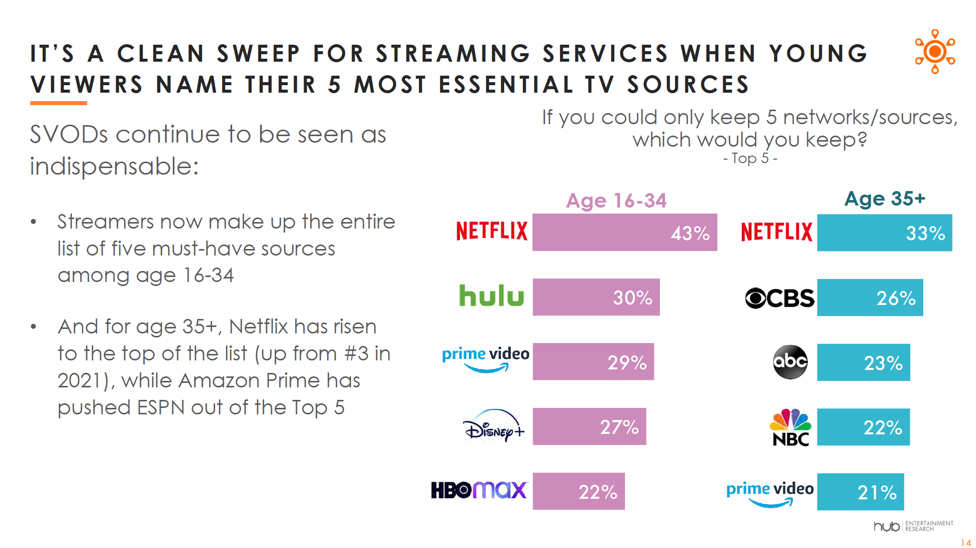
Big question #8: What types of content are valued most in the pay-TV bundle?
Quick answer: 51% of pay-TV subscribers are regular sports and news viewers.
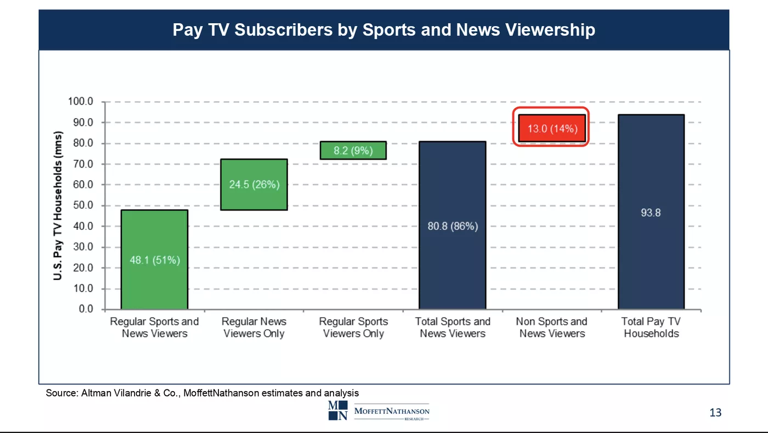
Bad sign: No cable network is in the top 5 most essential TV sources.