
Four big questions re: cord cutting:
1) How do Americans receive television?
2) How many homes currently subscribe to a pay-TV bundle?
3) What share of pay-TV subscriptions are streaming?
4) How many homes currently subscribe to broadband?
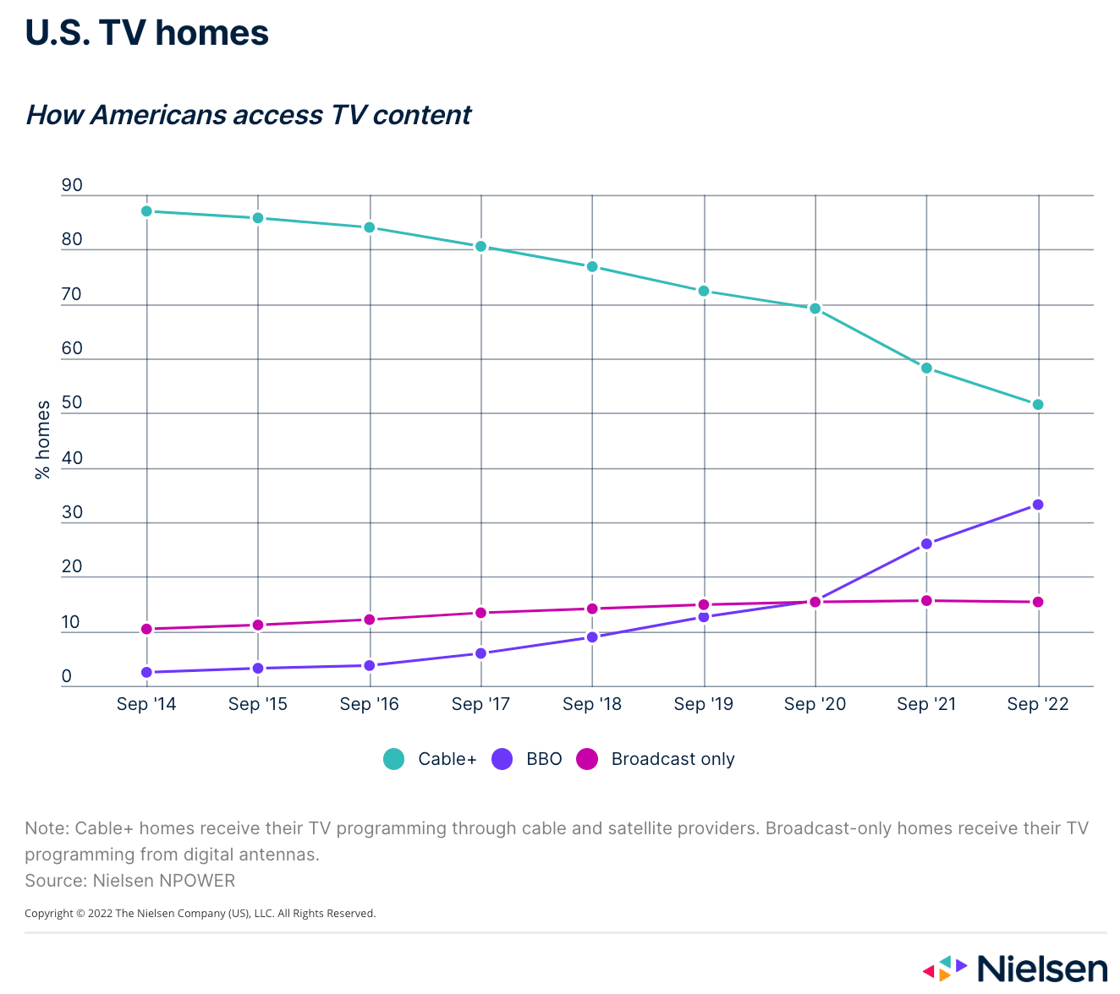
Big question #1: How do Americans receive television?
Share of U.S. TV households by source according to Nielsen:
1) Traditional pay-TV – 52%
2) Broadband-only – 33%
3) Antenna (OTA) – 15%
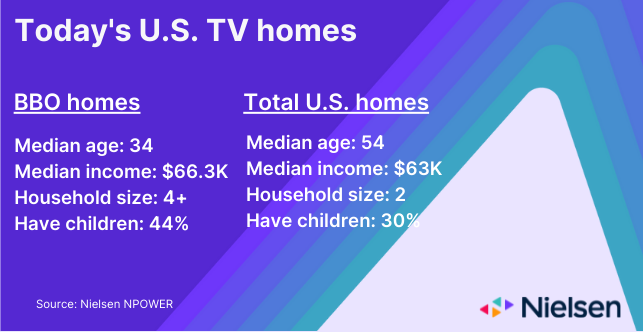
Wow: Broadband-only HHs are 20 years younger than the average U.S. HH. 44% of these households have children, and they are right in the middle of the 18-49 demo. This trend is just getting started.
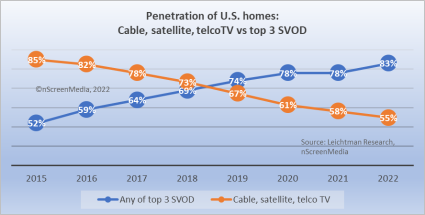
Bottom line: A traditional pay-TV bundle reaches 51% fewer households than the top three streaming services (SVOD). This is why advertisers are so excited about advertising on Netflix/Disney+.
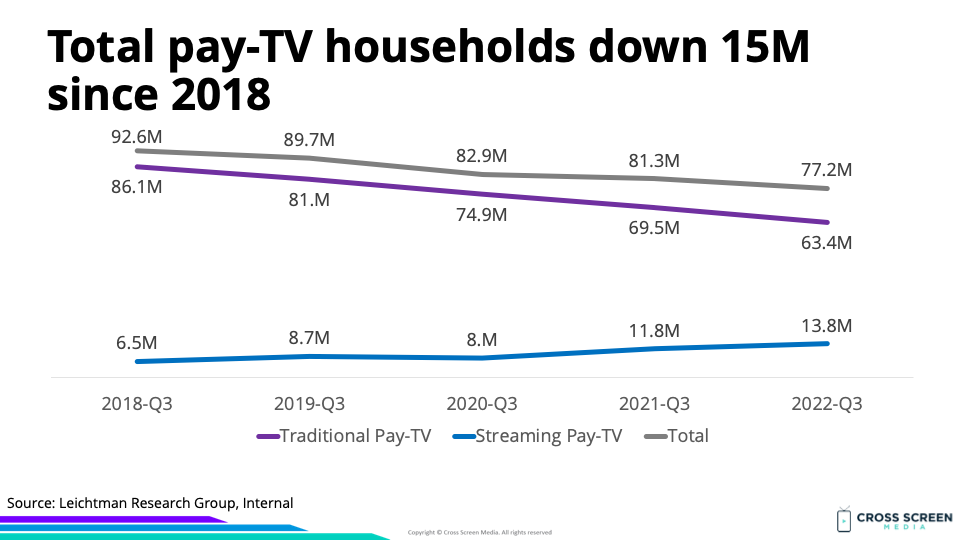
Big question #2: How many homes currently subscribe to a pay-TV bundle?
Quick answer: 77.2M
YoY change in pay-TV subscribers:
1) Traditional pay-TV – ↓ 6.1M
2) Streaming pay-TV – ↑ 2.0M
3) Total pay-TV – ↓ 4.1M
Why this matters: The largest decline (↓ 9%) YoY occurred during 2022-Q3. Streaming pay-TV (vMVPDs) is not picking up the slack since 3 households canceled traditional pay-TV for every 1 that added streaming pay-TV.
Quote from Anthony Crupi – Sports Media Reporter @ Sportico:
“If the [literal] decimation of the cable ranks in 12 months’ time isn’t sufficiently alarming, try zooming out a bit. In eight years’ time, 35.1 million households have parted ways with the likes of Comcast, Spectrum, DirecTV and DISH Network, and while the initial defections were minimal—in the second quarter of 2015, the rate of churn worked out to less than 1%—the losses have mounted in conjunction with the proliferation of alternative viewing platforms.”
YoY change for traditional pay-TV subscribers:
1) 2019-Q3 – ↓ 3%
2) 2020-Q3 – ↓ 8%
3) 2021-Q3 – ↓ 7%
4) 2022-Q3 – ↓ 9%
Total pay-TV subscriptions (YoY growth):
1) 2018-Q3 – 92.6M
2) 2019-Q3 – 89.7M (↓ 3%)
3) 2020-Q3 – 82.9M (↓ 8%)
4) 2021-Q3 – 81.3M (↓ 2%)
5) 2022-Q3 – 77.2M (↓ 5%)
Big question #3: What share of pay-TV subscriptions are streaming?
Quick answer: 18%
Streaming pay-TV subscriptions (YoY growth):
1) 2018-Q3 – 6.5M
2) 2019-Q3 – 8.7M (↑ 33%)
3) 2020-Q3 – 8.0M (↓ 8%)
4) 2021-Q3 – 11.8M (↑ 48%)
5) 2022-Q3 – 13.8M (↑ 17%)
Streaming share of pay-TV subscribers:
1) 2018-Q3 – 7%
2) 2019-Q3 – 10%
3) 2020-Q3 – 10%
4) 2021-Q3 – 15%
5) 2022-Q3 – 18%
Traditional pay-TV subscriptions (YoY growth):
1) 2018-Q3 – 86.1M
2) 2019-Q3 – 81.0M (↓ 6%)
3) 2020-Q3 – 74.9M (↓ 8%)
4) 2021-Q3 – 69.5M (↓ 7%)
5) 2022-Q3 – 63.4M (↓ 9%)
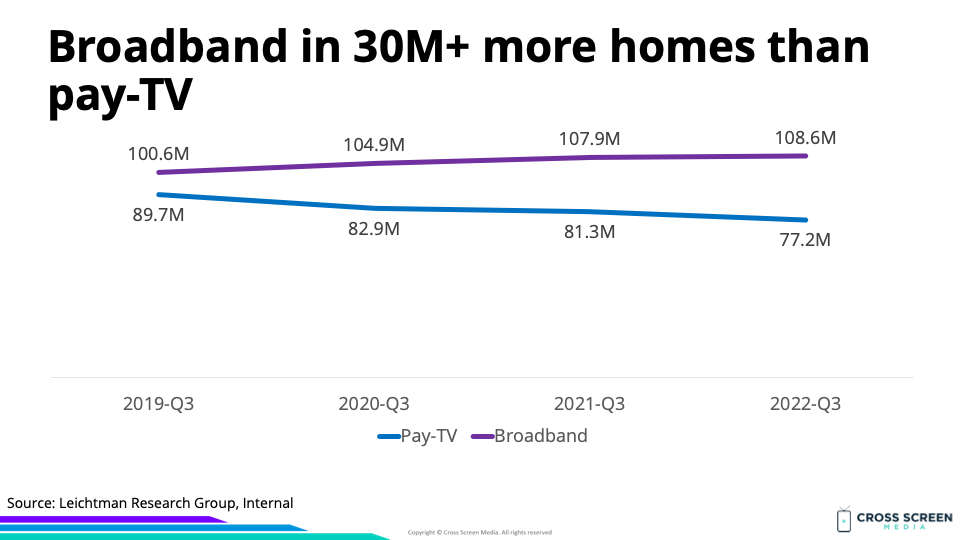
Big question #4: How many homes currently subscribe to broadband?
Total broadband subscriptions (YoY growth) according to Leichtman Research Group:
1) 2019-Q3 – 100.6M
2) 2020-Q3 – 104.9M (↑ 4%)
3) 2021-Q3 – 107.9M (↑ 3%)
4) 2022-Q3 – 108.6M (↑ 1%)
Quote from Craig Moffett – Analyst @ MoffettNathanson:
“Both Comcast and Charter have made it clear they are fully willing to let video customers walk, even to the point of helping them with streaming options if they desire.”

