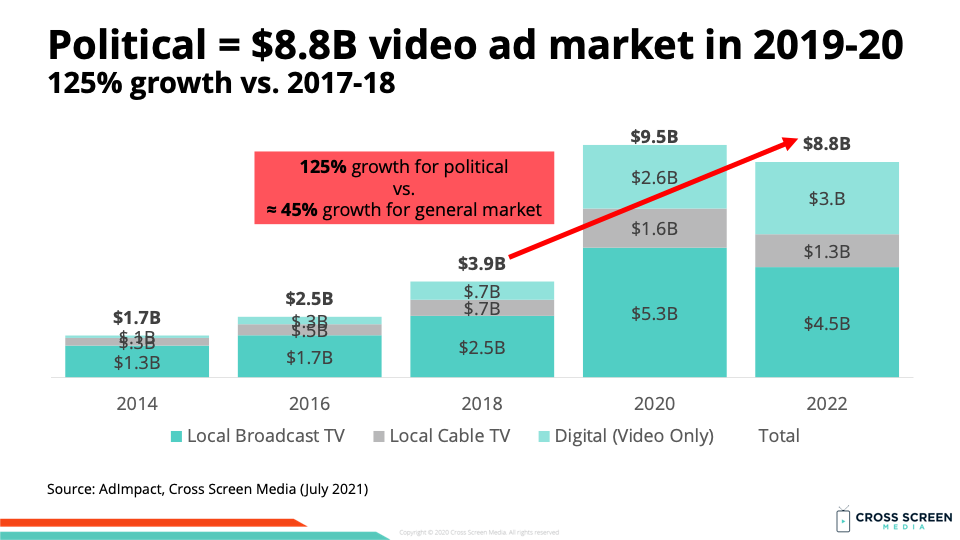
Big news #1: We project the political video ad market will reach $8.8B during the 2021-22 election cycle.
Key details for political video ad spending according to AdImpact/Cross Screen Media:
1) 2022 vs. 2018 – ↑ $4.8B (↑ 125%)
2) 2022 vs. 2020 – ↓ $697M (↓ 7%)
3) ≈ 6% of the entire U.S. video ad market
4) ≈ 18% of all video ad growth is from politics
Midterm cycle political video ad spending (% growth):
1) 2014 – $1.7B
2) 2018 – $3.9B (↑ 142%)
3) 2022P – $8.8B (↑ 125%)
Presidential cycle political video ad spending (% growth):
1) 2016 – $2.5B
2) 2020 – $9.5B (↑ 283%)
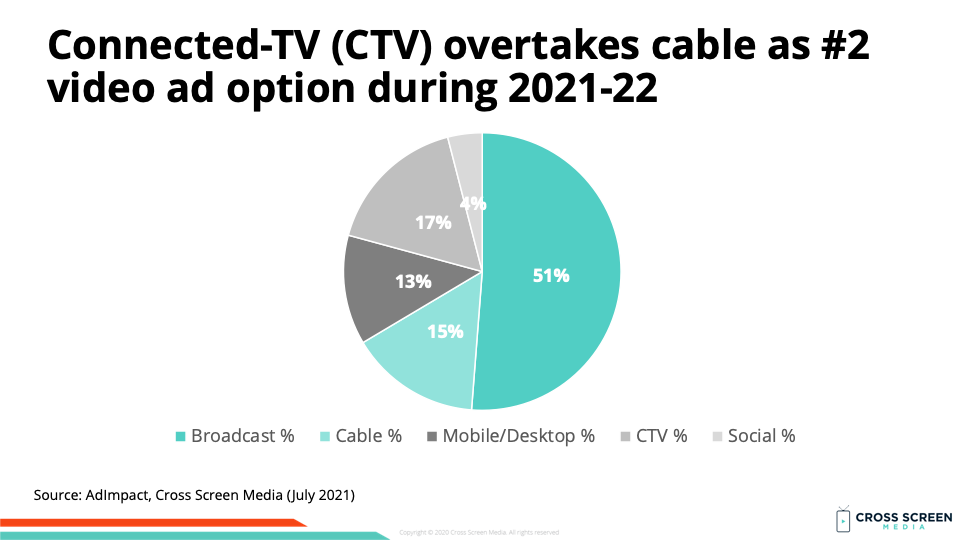
Big news #2: We are breaking out Connected-TV (CTV) for the first time in 2022.
Share of political video ad spend by screen type:
1) Local broadcast TV – 51%
2) Connected-TV (CTV) – 17%
3) Local cable TV – 15%
4) Mobile/desktop – 13%
5) Social video – 4%
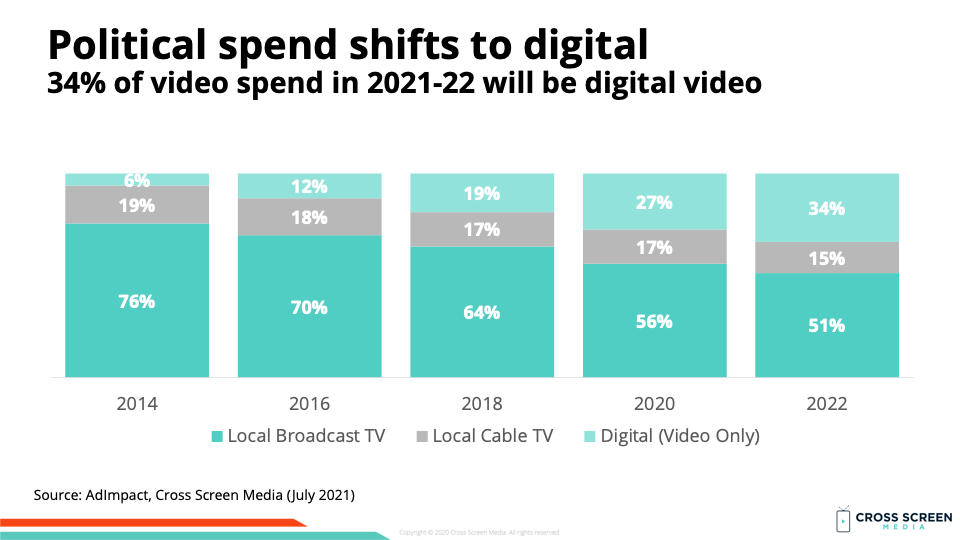
Digital share (including CTV) of political video ad spend:
1) 2014 – 6%
2) 2016 – 12%
3) 2018 – 19%
4) 2020 – 27%
5) 2022P – 34%
Why this matters: We predict CTV has now become the #2 screen type behind local broadcast TV.
Big question #1: Why are political buyers adopting CTV so rapidly?
Key reasons for political adoption of CTV:
1) Addressability and measurement
2) High impact creative
3) Unique reach from voters with little/no linear TV consumption
Wow: The political video ad market is growing (CAGR) at a rate of 23% compared to 10% for the general video ad market!
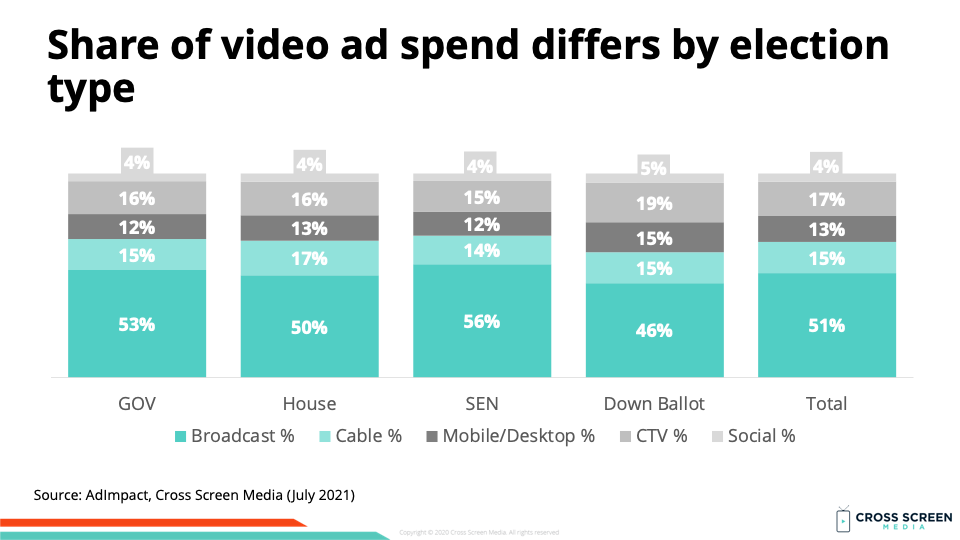
Big question #2: Does this share differ by election type?
Quick answer: Yes. U.S. Senate elections will spend the largest share of their video ad budget on linear TV (70%) while down ballot races will spend the lowest (61%).
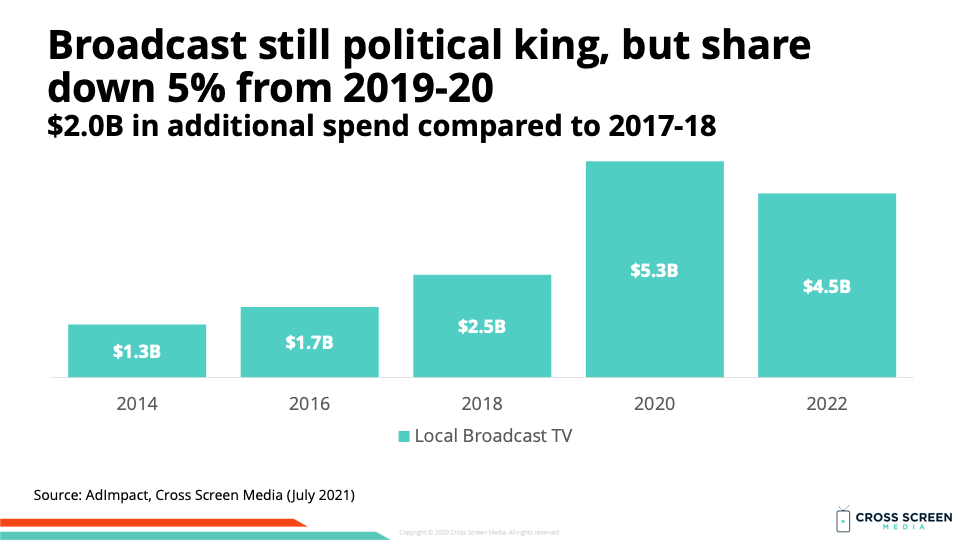
Local broadcast TV spend (% growth):
1) 2014 – $1.3B
2) 2016 – $1.7B (↑ 33%)
3) 2018 – $2.5B (↑ 46%)
4) 2020 – $5.3B (↑ 110%)
5) 2022P – $4.5B (↓ 15%)
Local cable TV spend (% growth):
1) 2014 – $320M
2) 2016 – $450M (↑ 41%)
3) 2018 – $660M (↑ 47%)
4) 2020 – $1.6B (↑ 142%)
5) 2022P – $1.3B (↓ 16%)

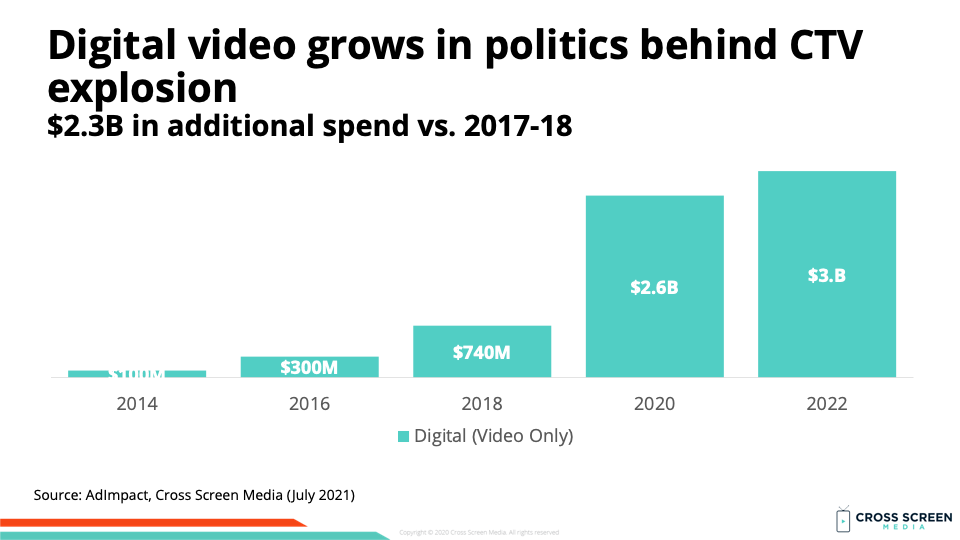
Digital video (including CTV) spend (% growth):
1) 2014 – $100M
2) 2016 – $300M (↑ 200%)
3) 2018 – $740M (↑ 147%)
4) 2020 – $2.6B (↑ 251%)
5) 2022P – $3.0B (↑ 14%)
Big question #3: Do you want to sell more political ads in 2022? If yes, then download our FREE 12-page report, and let’s get started!