Five big questions re: how we watch TV:
1) Is broadcast/cable gaining ground on streaming?
2) Is ad-supported streaming growing?
3) Which streaming networks account for the highest share of total TV?
4) How many channels do we watch?
5) What other non-TV platforms are we watching videos on?
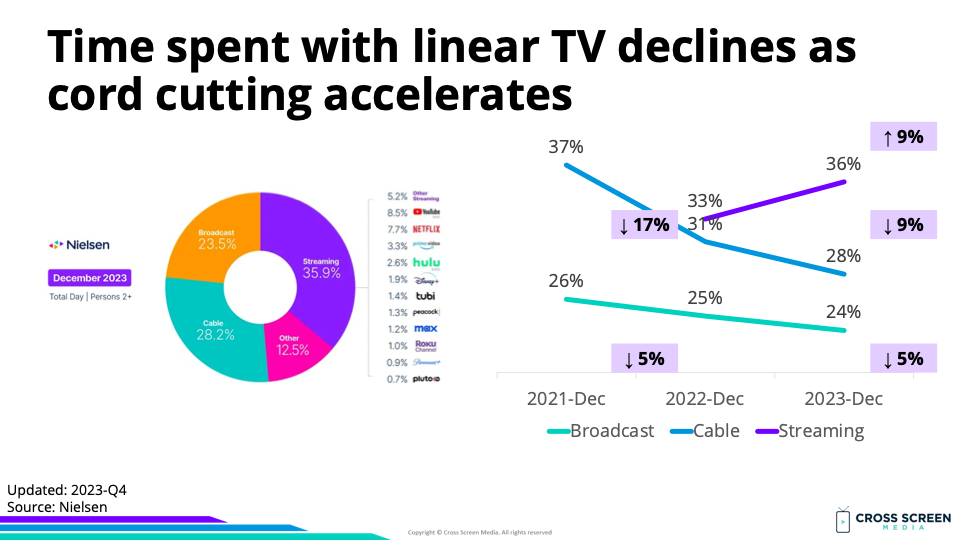
Big question #1: Is broadcast/cable gaining ground on streaming?
Quick answer: No. Time spent with linear TV is down 7% YoY and 18% vs. two years ago.
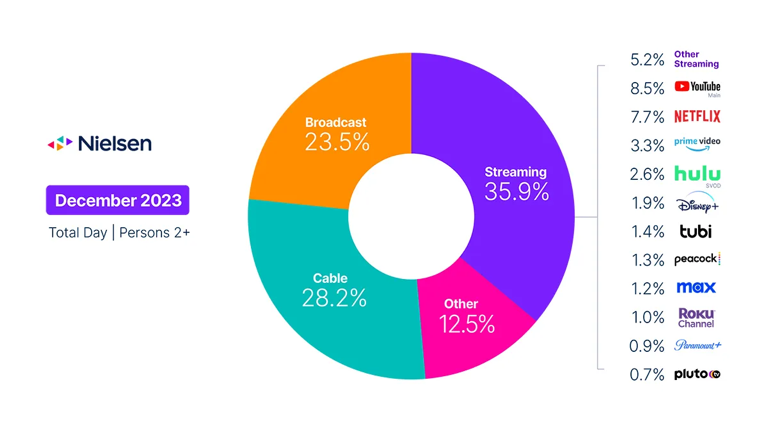
Share of total TV time according to Nielsen:
1) Streaming – 36%
2) Cable – 28%
3) Broadcast – 24%
4) Other – 13%
Change in ratings for 2023 vs. 2021, according to Anthony Crupi:
1) NFL regular season – ↑ 4%
2) Overall linear TV – ↓ 18%
What has stayed the same: We watch a ton of NFL football games.
What has changed: We watch far less of everything else.
Flashback: Linear TV = Football With a Side of News

Wow: In 2012-13, 20 different shows on broadcast drew 10M+ viewers. Last year (10 years later), zero shows hit that number.
Sessions per month for average viewer (September 2023) according to Nielsen:
1) Fox News – 10.6 times
2) MSNBC – 10.1
3) YouTube – 8.8
4) ABC – 8.6
5) NBC – 8.1
6) CBS – 8.1
7) Netflix – 7.6
8) CNN – 7.4
9) Hulu – 7.1
10) FOX – 6.5
Big question #2: Is ad-supported streaming growing?
Share of total TV time by streaming type according to Entertainment Strategy Guy:
1) Subscription video-on-demand (SVOD) – 19%
2) Ad-supported video-on-demand (AVOD) – 9%
3) Free ad-supported streaming (FAST) – 3%
YoY change for total TV time by streaming type:
1) FAST – ↑ 288%
2) AVOD – ↑ 13%
3) SVOD – ↑ 7%

Big question #3: Which streaming networks account for the highest share of total TV?
Share of total TV time (streaming only):
1) YouTube – 9%
2) Netflix – 8%
3) Amazon Prime – 3%
4) Hulu – 4%
5) Disney+ – 2%
6) Tubi – 1%
7) Peacock – 1%
8) HBO Max – 1%
9) Roku Channel – 1%
10) Paramount+ – 1%
11) PlutoTV – 1%
12) Other – 5%
Big question #4: How many channels do we watch?
Quick answer: 16 or fewer.

Big question #5: What other non-TV platforms are we watching videos on?
Quick answer: TikTok.
Average minutes per day among 18+ users according to eMarketer:
1) Netflix – 62
2) TikTok – 58
3) YouTube – 49
Wow: A TikTok user spends virtually the same amount (94%) of time with the app as a Netflix user.


