Seven big questions re: how we watch TV:
1) Is broadcast/cable gaining ground on streaming?
2) What is the most popular starting point for watching TV?
3) How many households watch ad-supported streaming?
4) How much time do we spend with ad-supported streaming?
5) Which age groups watch the most ad-supported streaming?
6) Which streaming networks generate the most viewing time?
7) Which streaming networks account for the highest share of total TV?
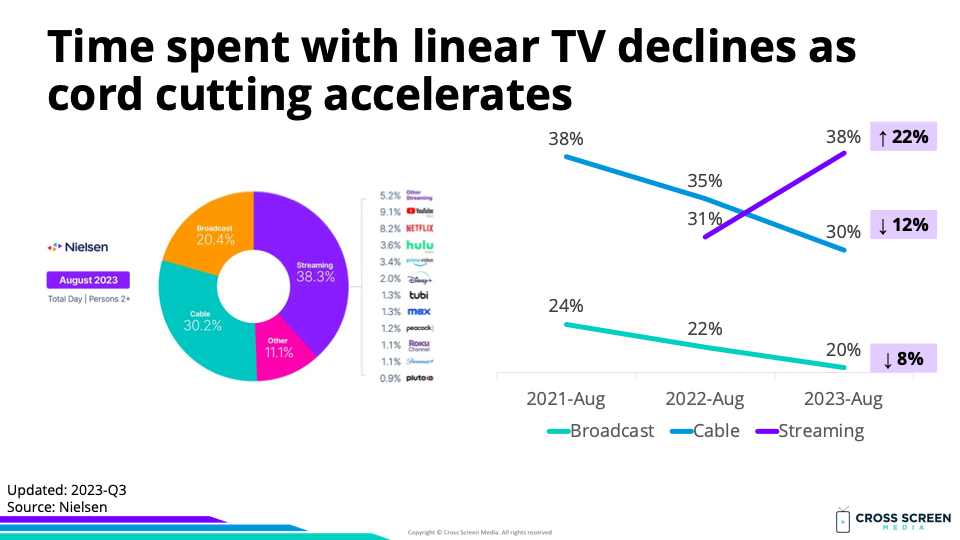
Big question #1: Is broadcast/cable gaining ground on streaming?
Share of total TV time according to Nielsen:
1) Streaming – 39%
2) Cable – 30%
3) Broadcast – 20%
4) Other – 12%
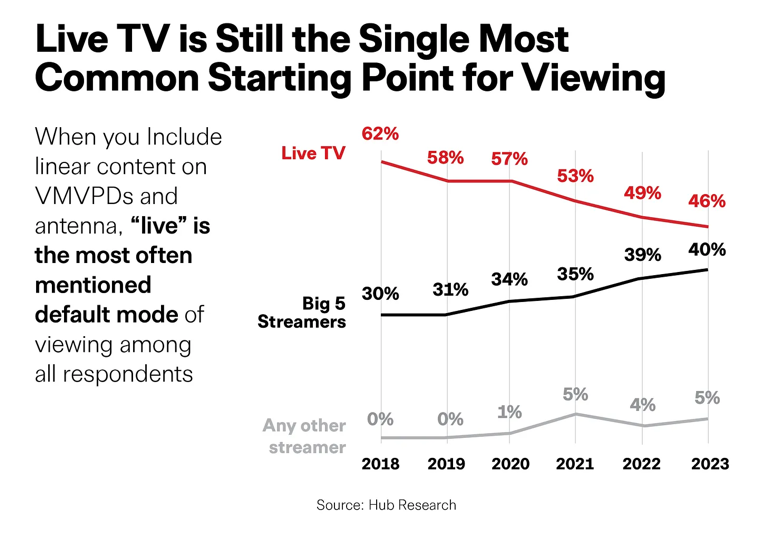
Big question #2: What is the most popular starting point for watching TV?
The most popular starting point for watching TV, according to Hub Research:
1) Live TV – 46%
2) Big 5 Streamers – 40%
3) Any other Streamer – 5%
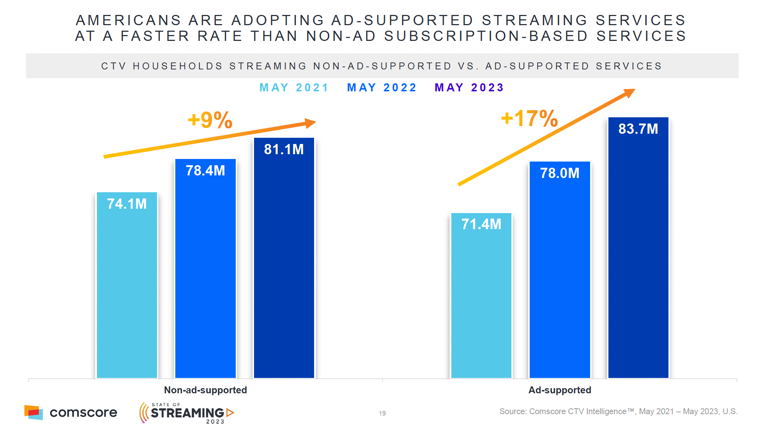
Big question #3: How many households watch ad-supported streaming?
% change in reach by revenue model according to Comscore:
1) Ad-supported – ↑ 17%
2) Subscription – ↑ 9%
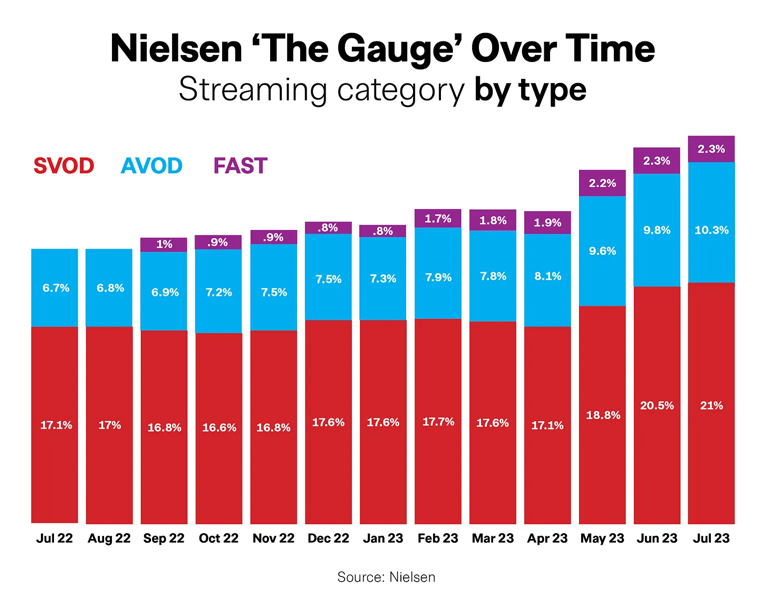
Big question #4: How much time do we spend with ad-supported streaming?
Share of total TV time by streaming type according to Entertainment Strategy Guy:
1) Subscription video-on-demand (SVOD) – 21%
2) Ad-supported video-on-demand (AVOD) – 10%
3) Free ad-supported streaming (FAST) – 2%
YoY change for total TV time by streaming type:
1) FAST – ↑ 71%
2) AVOD – ↑ 27%
3) SVOD – ↑ 19%
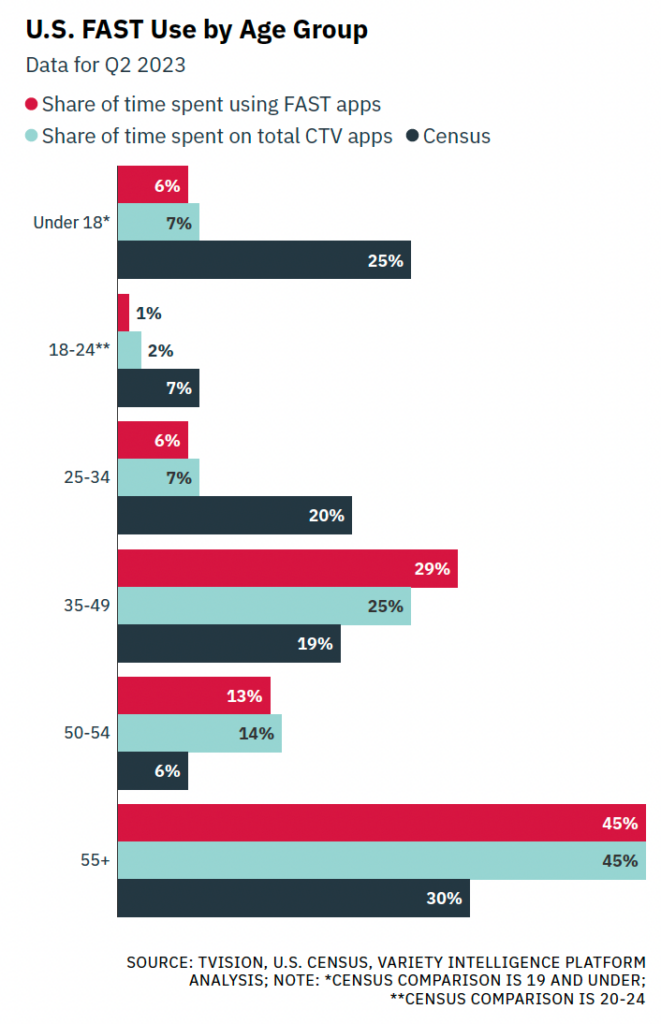
Big question #5: Which age groups watch the most ad-supported streaming?
Share of free ad-supported streaming (FAST) time according to TVision:
1) 55+ – 45%
2) 35-49 – 29%
3) 50-54 – 13%
4) 25-34 – 6%
5) < 18 – 6%
6) 18-24 – 1%
Big question #6: Which streaming networks generate the most viewing time?
Total monthly hours of viewing time according to SportsTVRatings:
1) YouTube (ad-supported) – 4.3B
2) Netflix – 4.0B
3) Hulu – 2.3B
4) Amazon – 1.6B
5) Disney+ – 926M
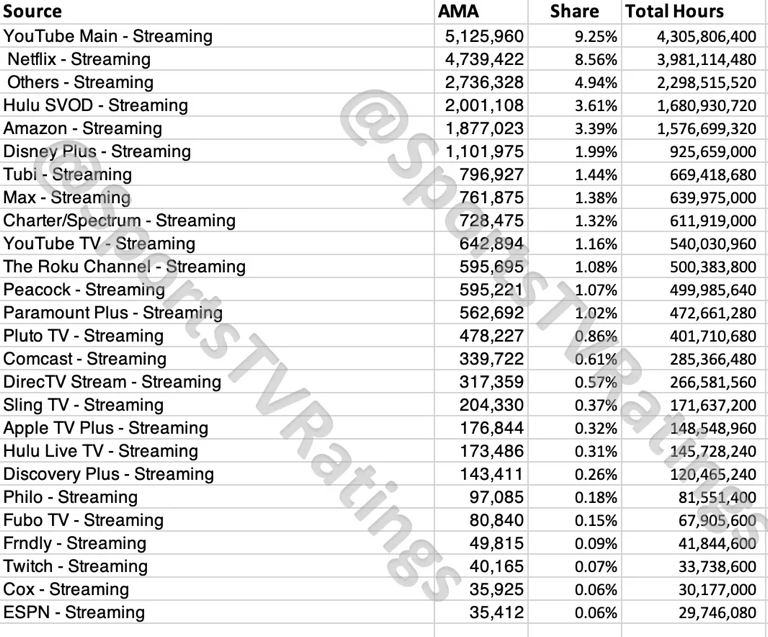
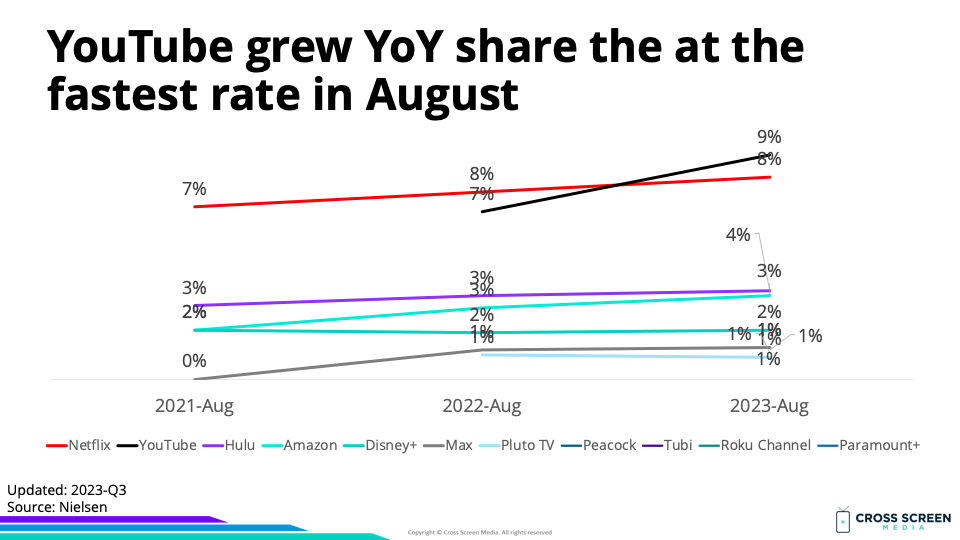
Big question #7: Which streaming networks account for the highest share of total TV?
Share of total TV time (streaming only):
1) YouTube – 9%
2) Netflix – 8%
3) Hulu – 4%
4) Amazon Prime – 3%
5) Disney+ – 2%
6) Tubi – 1%
7) HBO Max – 1%
8) Peacock – 1%
9) Roku Channel – 1%
10) Paramount+ – 1%
11) PlutoTV – 1%
12) Other – 5%