Setting the table: This is the 12th part of our Road to the White House series.
1) 11 Billion Reasons to Care About Political Video Ads
2) The Battle for Iowa (Part 1)
3) The Battle for Iowa (Part 2)
4) The Battle For New Hampshire
5) Is Biden Reaching Enough Swing Voters?
6) Biden vs. Trump I
7) The GOP Convention
8) The Race to Define Kamala Harris
9) The DNC Convention
10) Trump vs. Harris I
11) How We Vote
12) Who Is Voting Early
Seven big questions re: who is voting early:
1) Who is currently ahead in the polls?
2) How many have voted?
3) How do early voters watch TV?
4) Which TV consumption group votes at the highest rate?
5) How do we reach the remaining swing voters?
6) Who is winning the ad war?
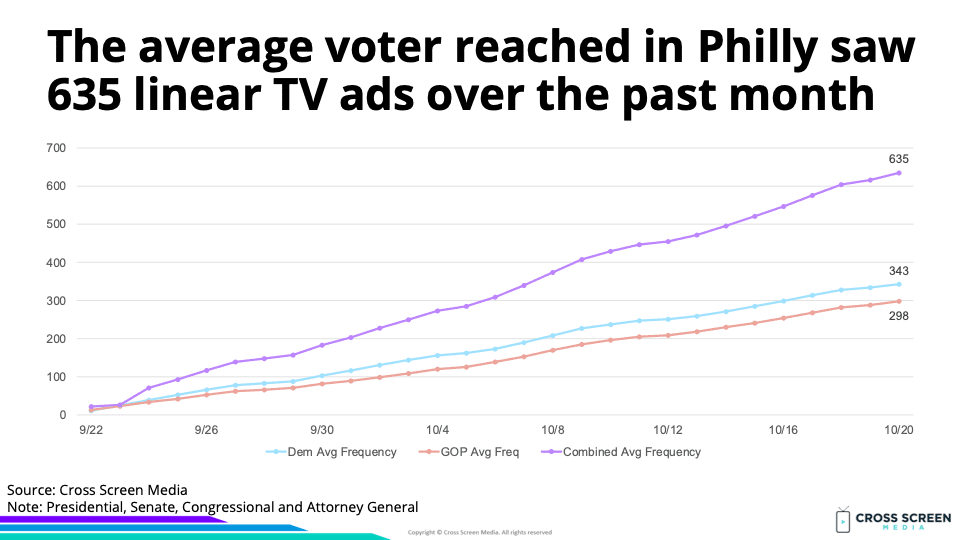
7) How many ads per week do voters see in battleground states?
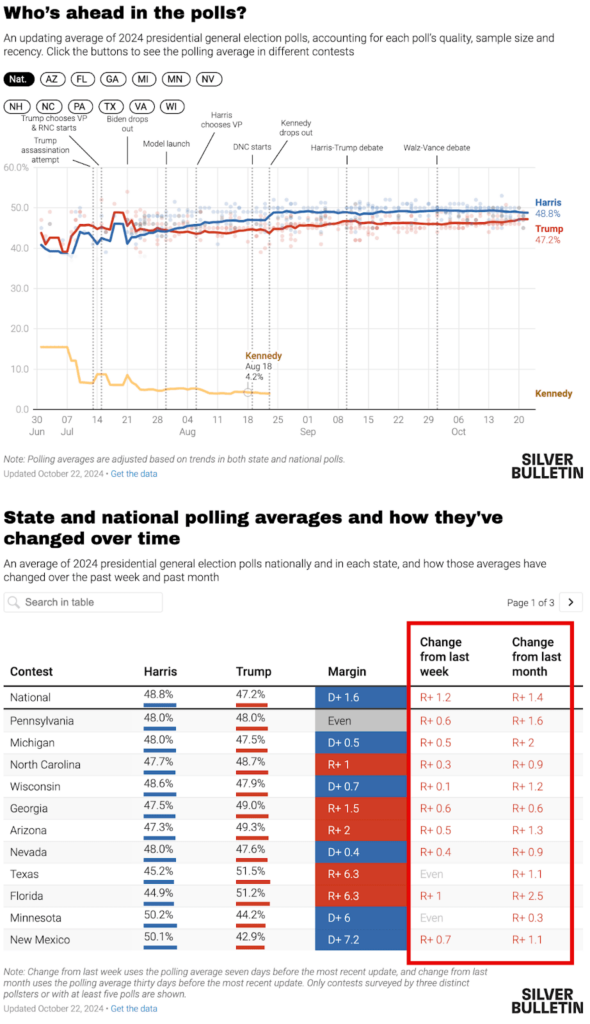
Big question #1: Who is currently ahead in the polls?
Quick answer: As far as the state level (electoral college) is concerned, Trump and Harris only differ by 1% or less in five states.
Big question #2: How many have voted?
Quick answer: 28.5M
Voting method in the 2024 election (% of total) through October 23rd, according to the Election Lab:
1) Early by Mail – 16.2M (57%)
2) Early in Person – 12.3M (43%)
3) Total – 28.5M
FYI: 4M+ voted yesterday!
Bottom line: A few weeks back (SOTS #387), we estimated the total turnout at 153M. If this holds, 19% of the votes have already been cast.
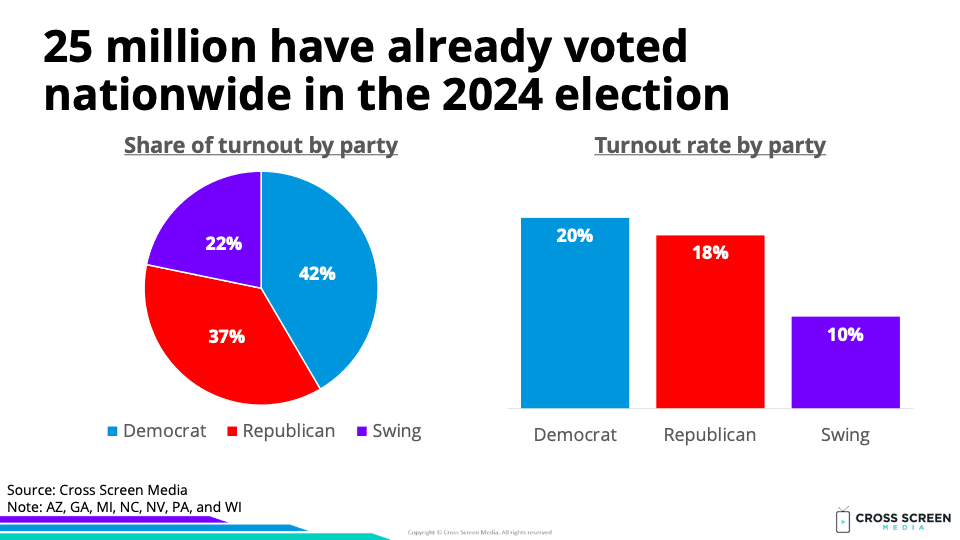
Share of early vote in battleground states according to Cross Screen Media:
1) Democrats – 42%
2) Republicans – 37%
3) Swing – 22%
Turnout rate in battleground states:
1) Democrats – 20%
2) Republicans – 18%
3) Swing – 10%
Turnout rate by state according to the Election Lab:
1) Georgia – 27%
2) North Carolina – 25%
3) Nevada – 16%
4) Arizona – 16%
5) Michigan – 15%
6) Pennsylvania – 14%
7) Wisconsin – 11%
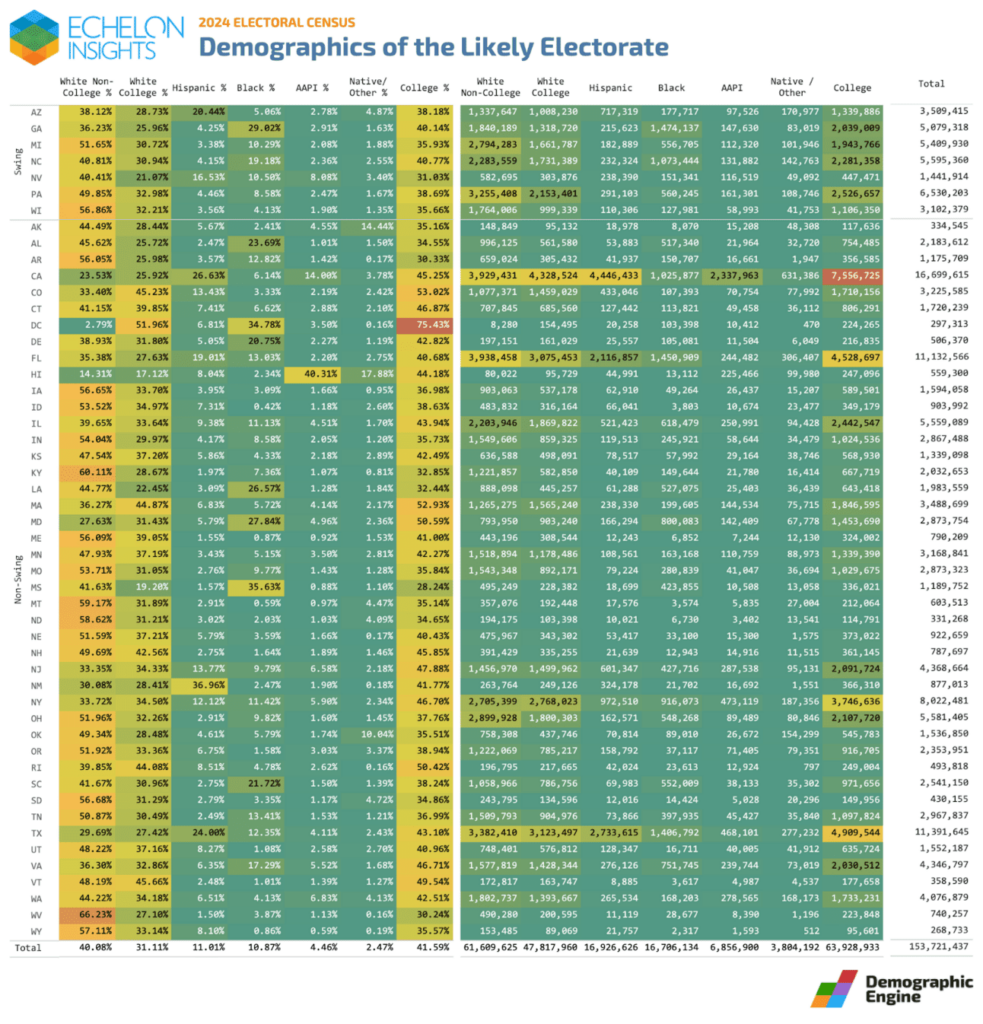
Dive deep: Echelon Insights recently published an amazing breakdown of the 2024 electorate.
Big question #3: How do early voters watch TV?
Share of early vote in battleground states:
1) Cross screen – 33%
2) Linear TV only – 26%
3) Streaming TV only – 23%
4) Unreachable – 17%
Turnout rate in battleground states:
1) Linear TV only – 21%
2) Unreachable – 20%
3) Cross Screen – 14%
4) Streaming TV only – 13%
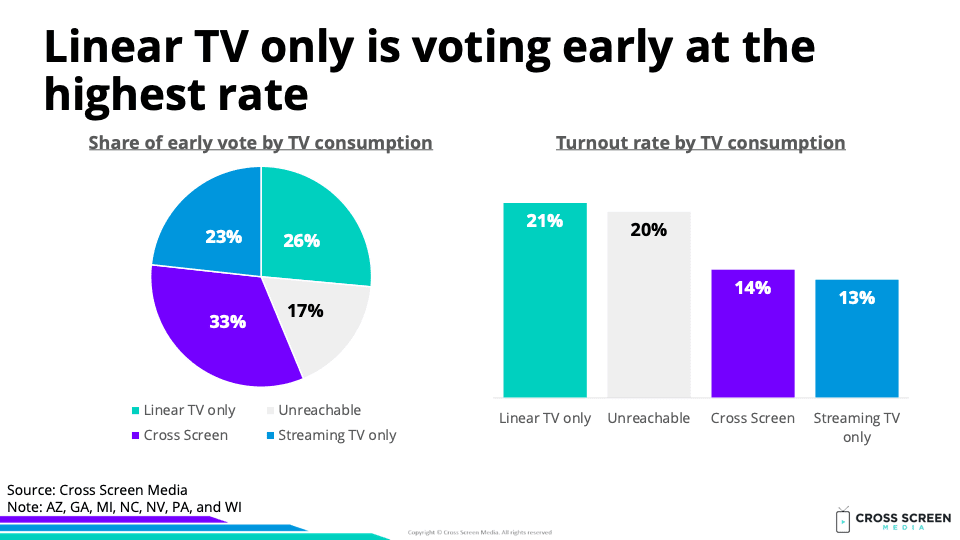
Interesting: The unreachable group is near the top in terms of turnout rate. A large portion of this audience comprises high-income households that can pay for ad-free services. Higher-income voters turn out at a higher rate.
Big question #4: Which TV consumption group votes at the highest rate?
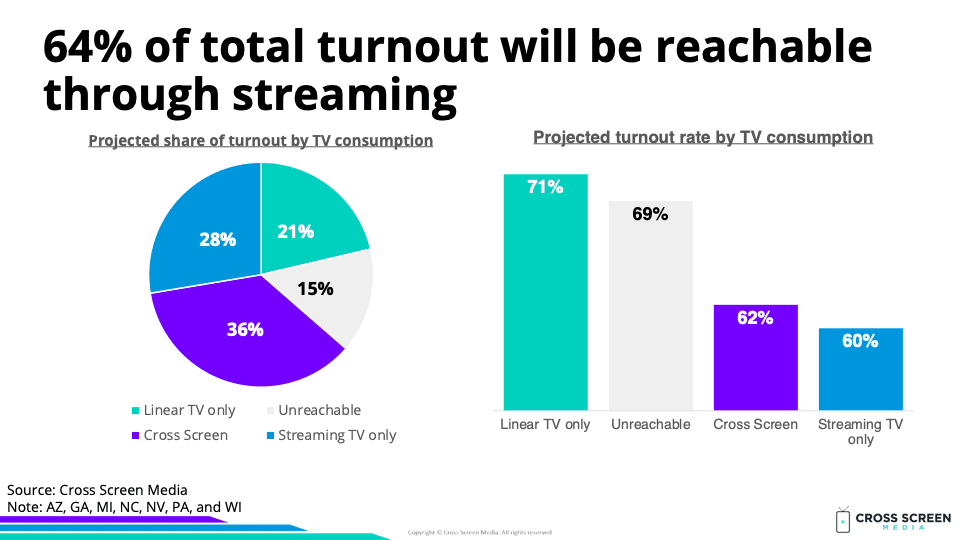
Projected turnout rate in the 2024 election:
1) Linear TV only – 71%
2) Unreachable – 69%
3) Cross screen – 62%
4) Streaming TV only – 60%
5) Total – 64%
Projected share of turnout in the 2024 election:
1) Cross screen – 36%
2) Streaming TV only – 28%
3) Linear TV only – 21%
4) Unreachable – 15%
Big question #5: How do we reach the remaining swing voters?
Quick math on remaining swing voters in battleground states:
1) 14.4M registered voters
2) 1.4M have already voted early
3) 90% of swing voters in battleground states have not voted
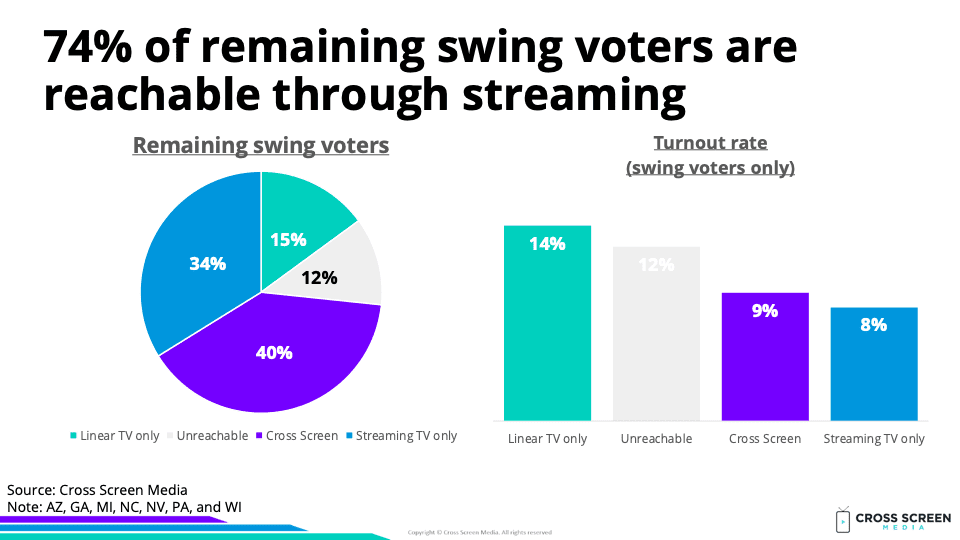
Share of remaining swing voters in battleground states:
1) Cross screen – 40%
2) Streaming TV only – 34%
3) Linear TV only – 15%
4) Unreachable – 12%
Big question #6: Who is winning the ad war?
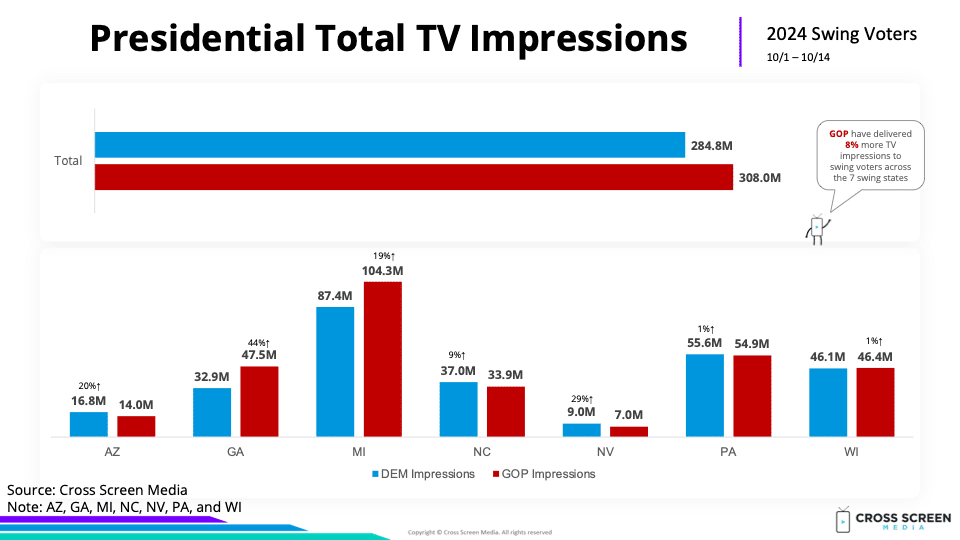
Share of linear TV ad impressions to swing voters (% of total):
1) Republicans – 308M (52%)
2) Democrats – 285M (48%)
Big question #7: How many ads per week do voters see in battleground states?
Wow: Over the past month, the average voter reached in Philadelphia saw 635 political ads on linear TV alone!
