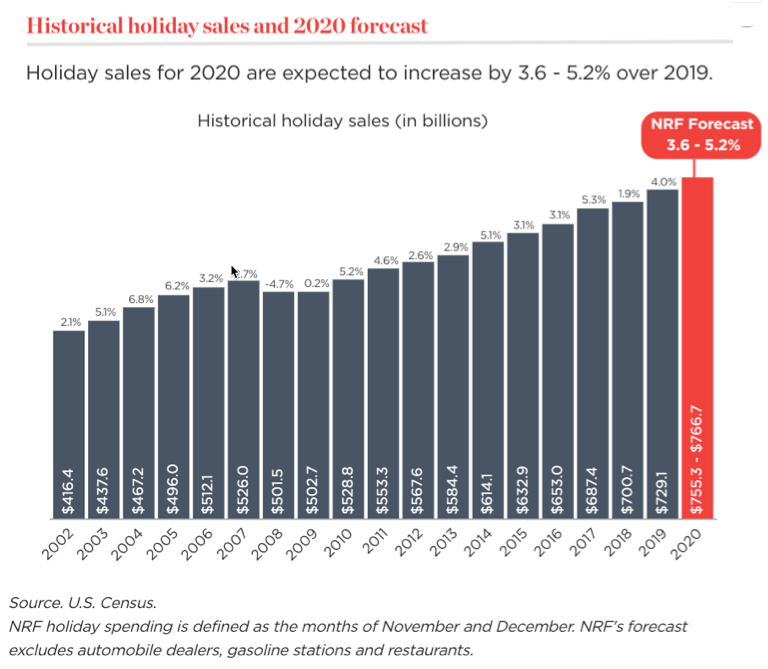
Total holiday spend according to the National Retail Federation:
1) 2009 – $503B (↑ 0%)
2) 2010 – $529B (↑ 5%)
3) 2011 – $553B (↑ 5%)
4) 2012 – $568B (↑ 3%)
5) 2013 – $584B (↑ 3%)
6) 2014 – $614B (↑ 5%)
7) 2015 – $633B (↑ 3%)
8) 2016 – $653B (↑ 3%)
9) 2017 – $687B (↑ 5%)
10) 2018 – $701B (↑ 2%)
11) 2019 – $729B (↑ 4%)
12) 2020P – $761B (↑ 4%)
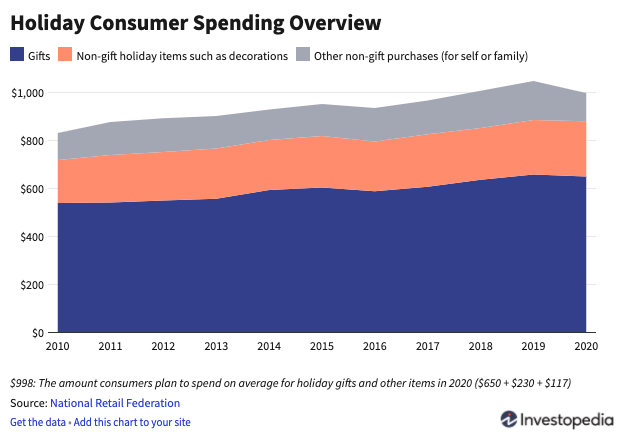
Average holiday spend per person (YoY growth):
1) 2009 – $783
2) 2010 – $831 (↑ 6%)
3) 2011 – $878 (↑ 6%)
4) 2012 – $893 (↑ 2%)
5) 2013 – $902 (↑ 1%)
6) 2014 – $929 (↑ 3%)
7) 2015 – $953 (↑ 3%)
8) 2016 – $936 (↓ 2%)
9) 2017 – $967 (↑ 3%)
10) 2018 – $1,007 (↑ 4%)
11) 2019 – $1,048 (↑ 4%)
12) 2020P – $997 (↓ 5%)
Breakdown of average holiday spend (% of total):
1) Gifts – $650 (65%)
2) Cards/Decorations – $230 (23%)
3) Travel/Other – $117 (12%)
FYI: The travel/other category is down 28% YoY.
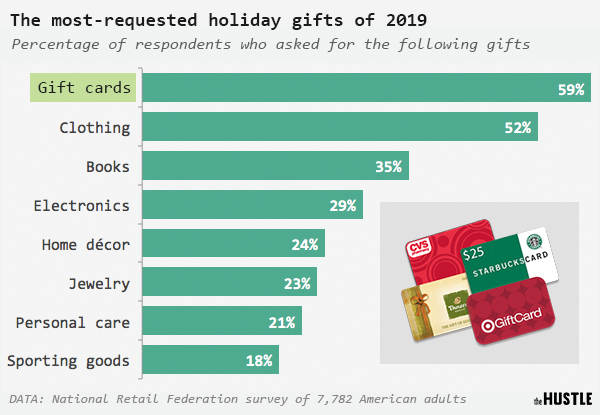
Big question #1: What is the most requested holiday gift?
Quick answer: 59% say gift cards.
Key details for the gift card economy:
1) $71B in gift cards were purchased in 2019
2) $1T+ over the past decade
3) $46B in unused gift cards are floating around
Unused gift card balance by company:
1) Amazon – $2.8B
2) Walmart – $1.9B
3) Starbucks – $1.6B
4) Target – $727M
Interesting: The average shopper spends $59 more than gift card value on their trip to redeem.
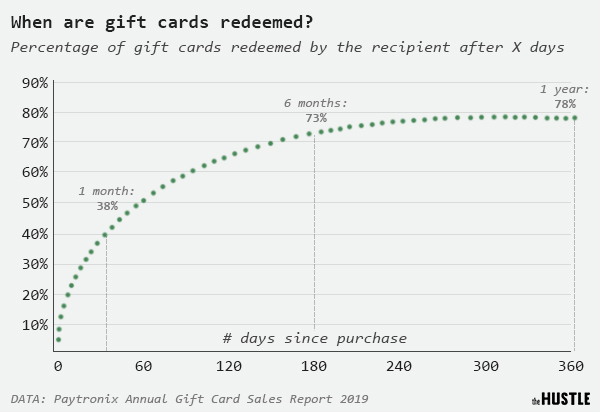
Big question #2: When are gift cards redeemed?
Share of gift cards redeemed after X months:
1) 1 month – 38%
2) 6 months – 73%
3) 12 months – 78%
More #1: ‘Big 3’ Holiday Days Exceed $22 Billion in Online Spending, Grow 25 Percent Year-Over-Year
More #2: The hardest-to-find toys each holiday season since 1983
More #3: How Tipsy Elves built a $125m ugly Christmas sweater empire


