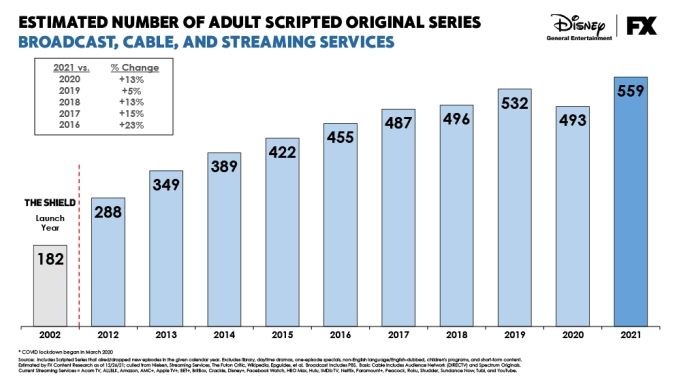
Original scripted shows by year (YoY growth) according to FX:
1) 2012 – 288 (↑ 8%)
2) 2013 – 349 (↑ 21%)
3) 2014 – 389 (↑ 11%)
4) 2015 – 422 (↑ 8%)
5) 2016 – 455 (↑ 8%)
6) 2017 – 487 (↑ 7%)
7) 2018 – 495 (↑ 2%)
8) 2019 – 532 (↑ 7%)
9) 2020 – 493 (↓ 7%)
10) 2021 – 559 (↑ 13%)

Quick math on change in attention for scripted shows between 2012-21:
1) Scripted shows – 288 → 559 (↑ 94%)
2) TV households – 115M →121M (↑ 5%)
3) Average daily time with video – 5h 13m → 5h 39m (↑ 8%)
4) Total time with video – ↑ 14%
Bottom line: Over the past ten years, the volume of scripted shows has grown 7X as fast as time spent with video.
Connecting the dots: If the volume of content has grown 7X the rate of time spent with video, then the average audience for a given show is 14% (1 / 7) the size that it was ten years ago. This is a challenge for ad/content measurement. The big question is, what happens if this trend continues and we are looking at 14% of today’s average audience (2% of 2012 audience) as we roll into 2030?
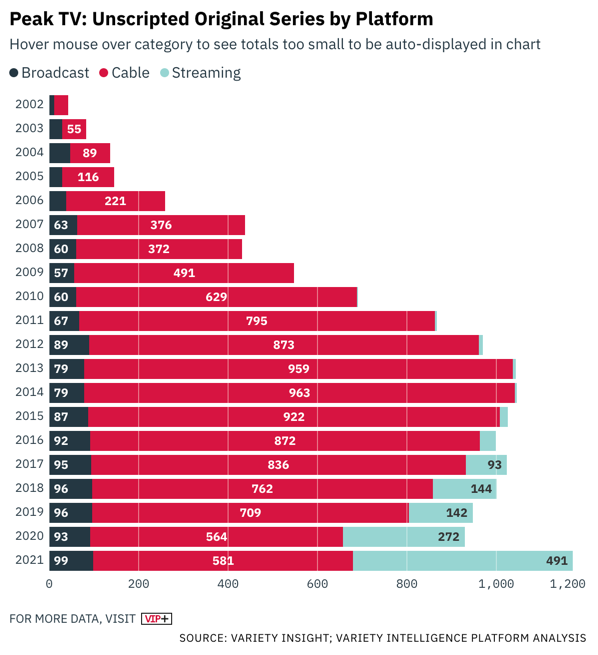
Next big thing: The streaming players are dusting off TV’s playbook from the early 2000s (Survivor, Big Brother, etc.). According to Variety, unscripted programming will add 1,172 series to the numbers above! Streaming will account for 42% of all unscripted series in 2021 vs. less than 4% five years ago (2016).
Why this matters: The cost of producing high-quality scripted shows (more below) has exploded, and unscripted programming is a low-cost way to continue churning out new content that will draw a niche audience.
Bottom line: An entire season of FBoy Island costs the same as 1-2 episodes of a scripted drama on HBO.
Outstanding questions:
1) Can this overall trend continue? For example, a 13% increase in 2022 would be 73 new shows.
2) Has there ever been a better time to have content to sell?


