Music industry retail revenue (YoY growth) according to the RIAA:
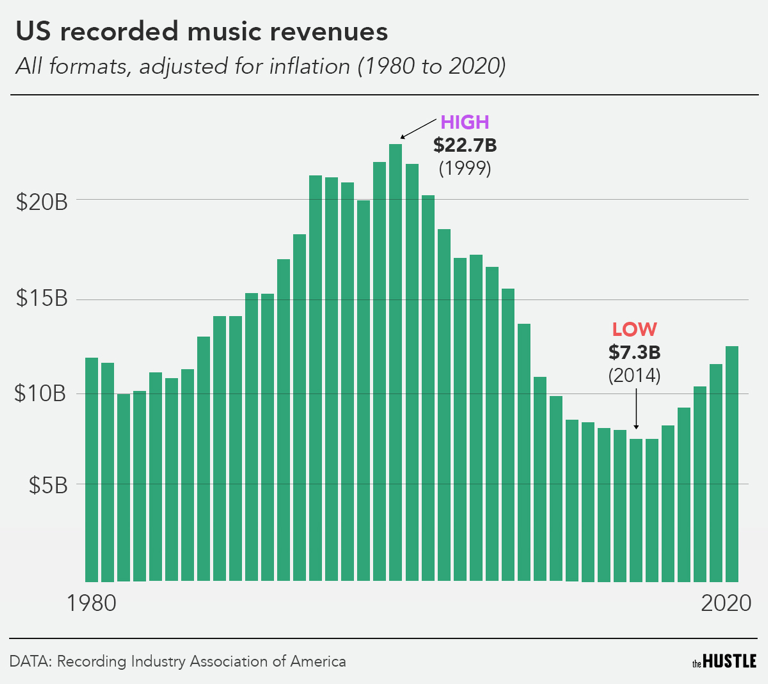
1) 2012 – $7.0B (↓ 1%)
2) 2013 – $7.0B (↑ 0%)
3) 2014 – $6.7B (↓ 4%)
4) 2015 – $6.7B (↑ 0%)
5) 2016 – $7.6B (↑ 13%)
6) 2017 – $8.8B (↑ 16%)
7) 2018 – $9.7B (↑ 10%)
8) 2019 – $11.1B (↑ 14%)
9) 2020 – $12.2B (↑ 9%)
10) 2021 – $15.0B (↑ 23%)
Source of music industry retail revenue (YoY growth):
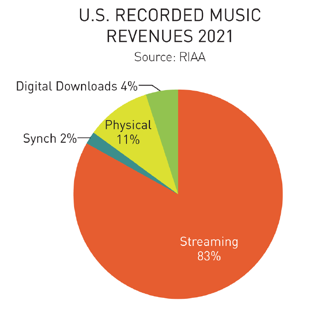
1) Streaming – 83%
2) Physical – 9%
3) Digital downloads – 6%
4) Synch – 2%
Streaming revenue for the music industry (YoY growth):
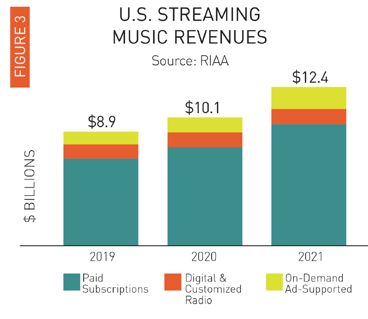
1) 2016 – $4.0B
2) 2017 – $5.7B (↑ 43%)
3) 2018 – $7.3B (↑ 28%)
4) 2019 – $8.9B (↑ 22%)
5) 2020 – $10.1B (↑ 13%)
6) 2021 – $12.4B (↑ 24%)
Streaming subscribers for the music industry (YoY growth):
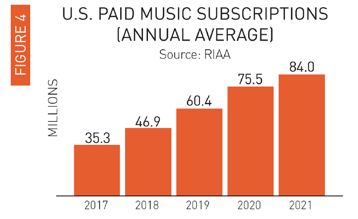
1) 2015 – 11M
2) 2016 – 23M (↑ 110%)
3) 2017 – 35M (↑ 56%)
4) 2018 – 47M (↑ 33%)
5) 2019 – 60M (↑ 29%)
6) 2020 – 76M (↑ 25%)
7) 2021 – 84M (↑ 11%)
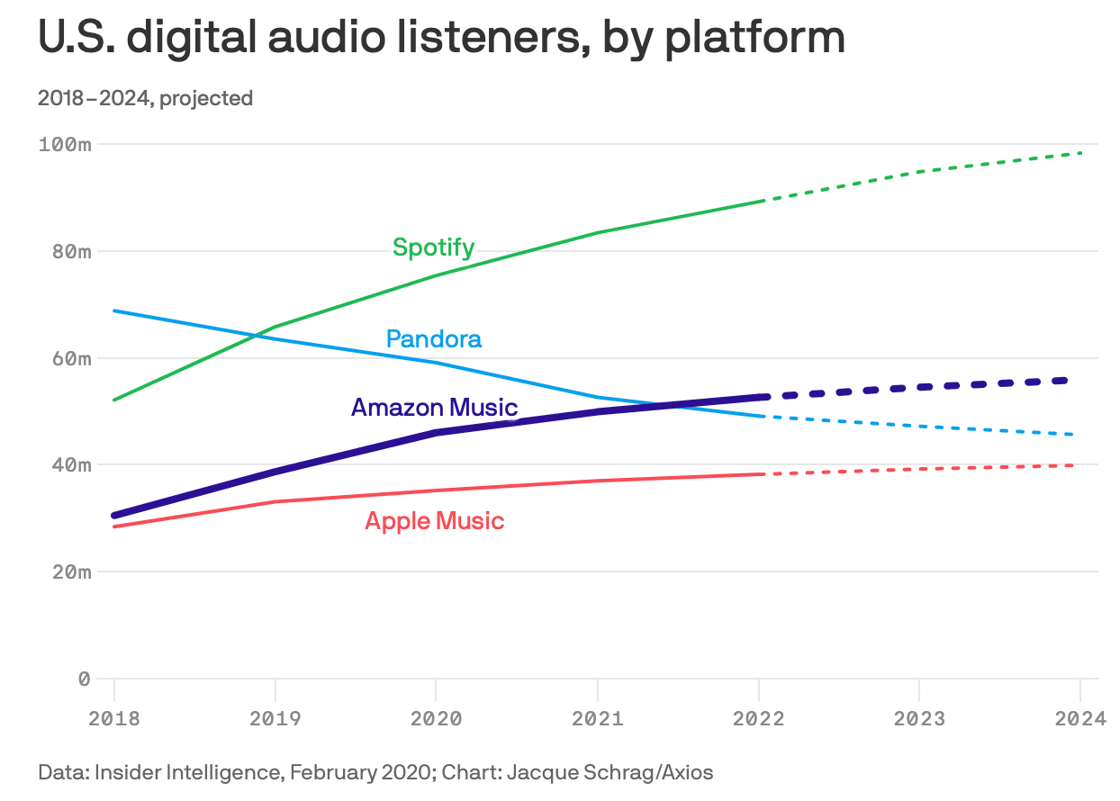
Big question #1: Which streaming service has the most U.S. subscribers?
Quick answer: Spotify.
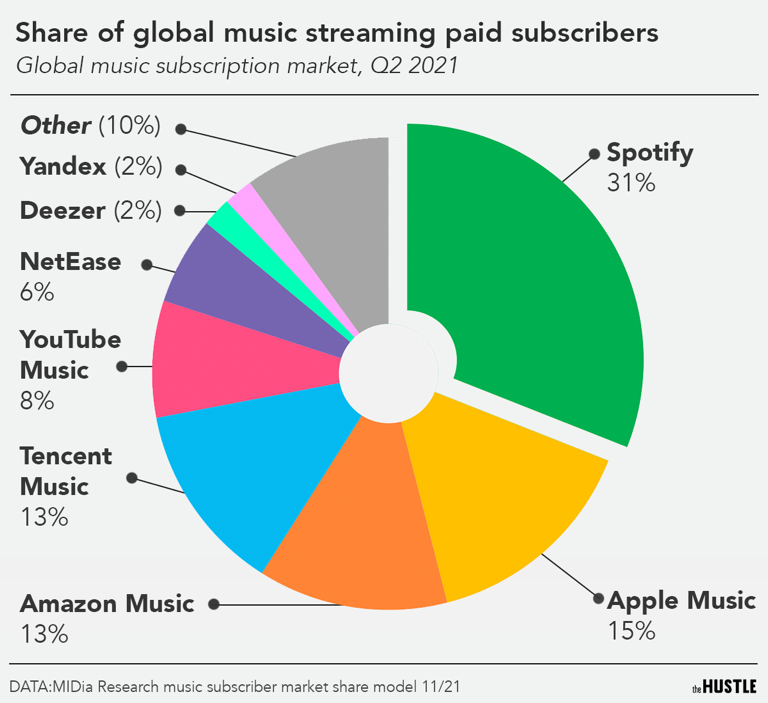
Big question #2: Which streaming service has the most global subscribers?
Quick answer: Spotify (again).
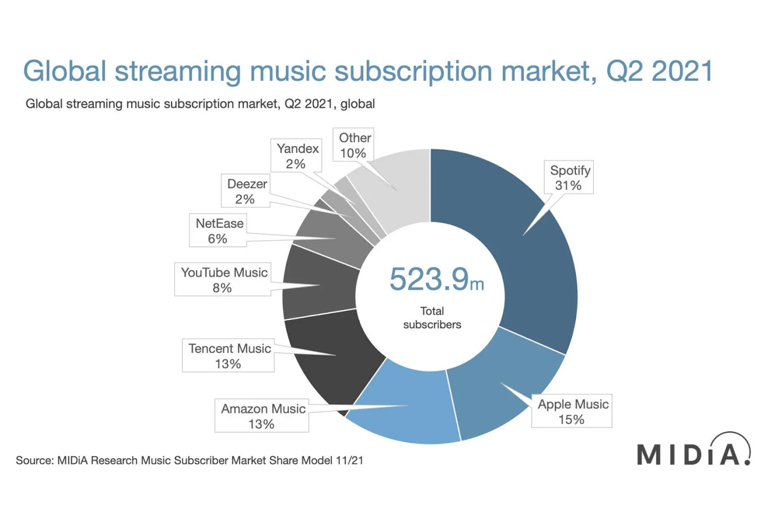
Big question #3: How many streaming subscribers are there globally?
Quick answer: 524M

