Six big questions re: Netflix:
1) How did Netflix subscriber growth compare to Wall Street expectations?
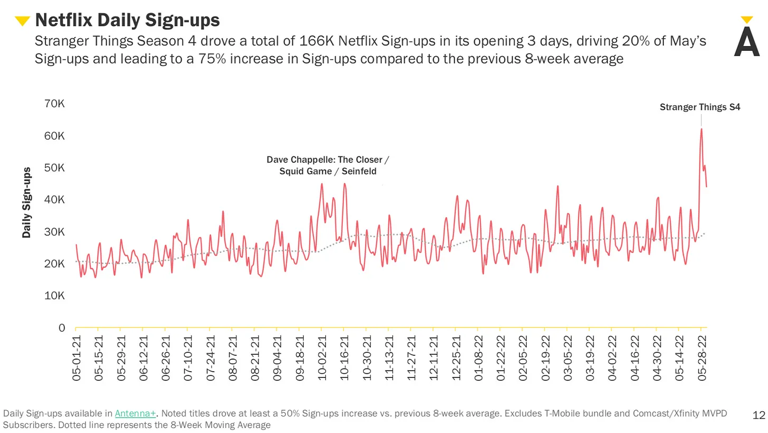
2) What content drove sign-ups??
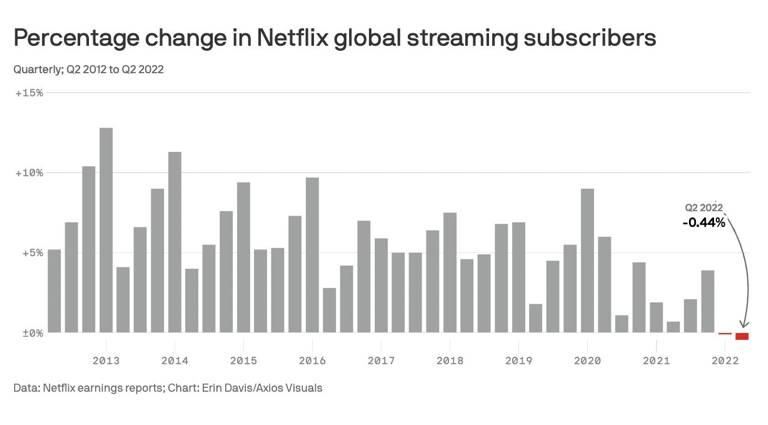
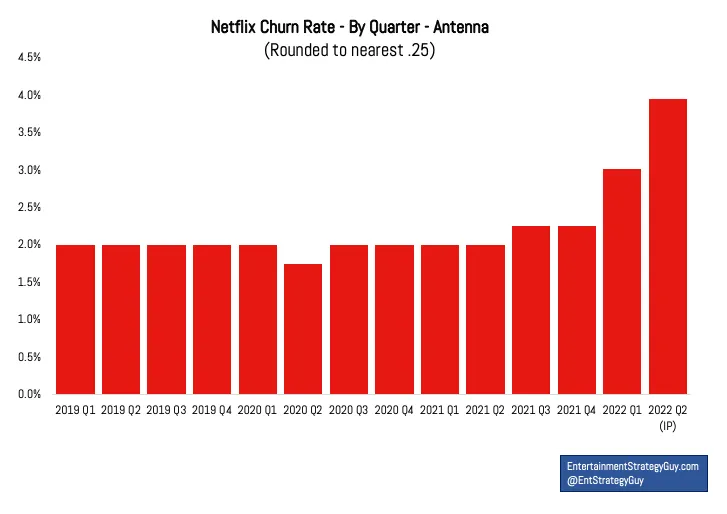
3) Why is Netflix losing subscribers?
4) Are people watching less Netflix?
5) Is revenue for Netflix declining?
6) When will Netflix launch ads?
Big question #1: How did Netflix subscriber growth compare to Wall Street expectations?
Netflix subscriber growth in 2022-Q2:
1) Projected – ↓ 2.0M
2) Actual – ↓ 970K
Netflix subscribers (YoY growth):
1) 2015-Q2 – 65.6M
2) 2016-Q2 – 83.2M (↑ 27%)
3) 2017-Q2 – 99.0M (↑ 19%)
4) 2018-Q2 – 124.4M (↑ 26%)
5) 2019-Q2 – 151.6M (↑ 22%)
6) 2020-Q2 – 193.0M (↑ 27%)
7) 2021-Q2 – 209.2M (↑ 8%)
8) 2022-Q2 – 220.7M (↑ 5%)
Netflix subscribers (% of total):
1) International – 147.4M (67%)
2) U.S./Canada – 73.3M (33%)
3) Total – 220.7M
Big question #2: What content drove sign-ups?
Quick answer: Stranger Things Season 4.
Wow: Stranger Things Season 4 set the Nielsen record for most weekly streaming minutes with 7.2B.
Big question #3: Why is Netflix losing subscribers?
Quick answer: Netflix is approaching saturation in developed markets. As a result, cancellations outpace new sign-ups in markets like the U.S.
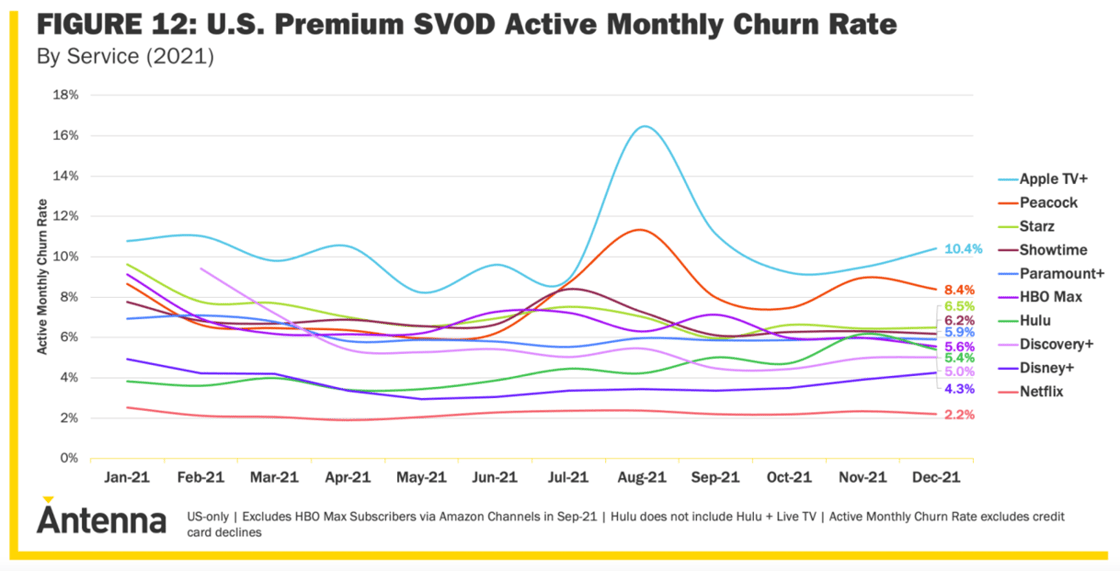
Why this matters: Netflix has led the pack with a churn rate roughly half the industry average. Multiple signs point to an increase in recent months.
Flashback: Antenna Breaks Down Streaming Between the Lines
Average monthly churn rate in 2021 by streaming service:
1) Netflix – 2.2%
2) Disney+ – 3.7%
3) Hulu – 4.3%
4) Average – 4.8%
5) Discovery+ – 5.6%
6) Paramount+ – 6.1%
7) HBO Max – 6.7%
8) Showtime – 6.8%
9) Starz – 7.1%
10) Peacock – 7.7%
11) Apple TV+ – 10.5%
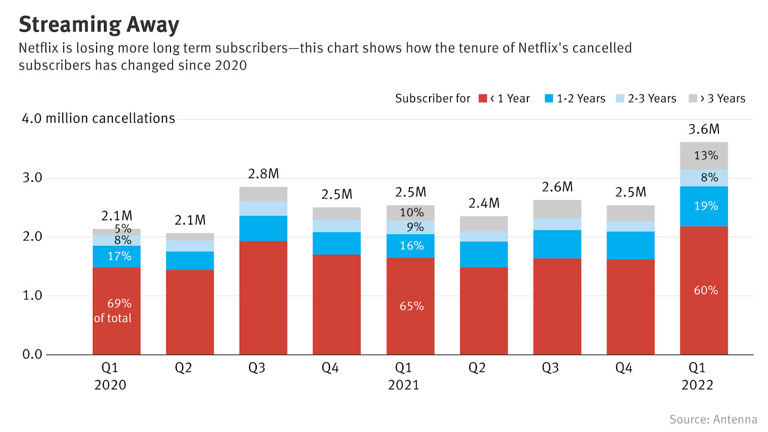
Interesting #1: 60% of Netflix cancellations come from subscribers who’ve had the service for less than a year.
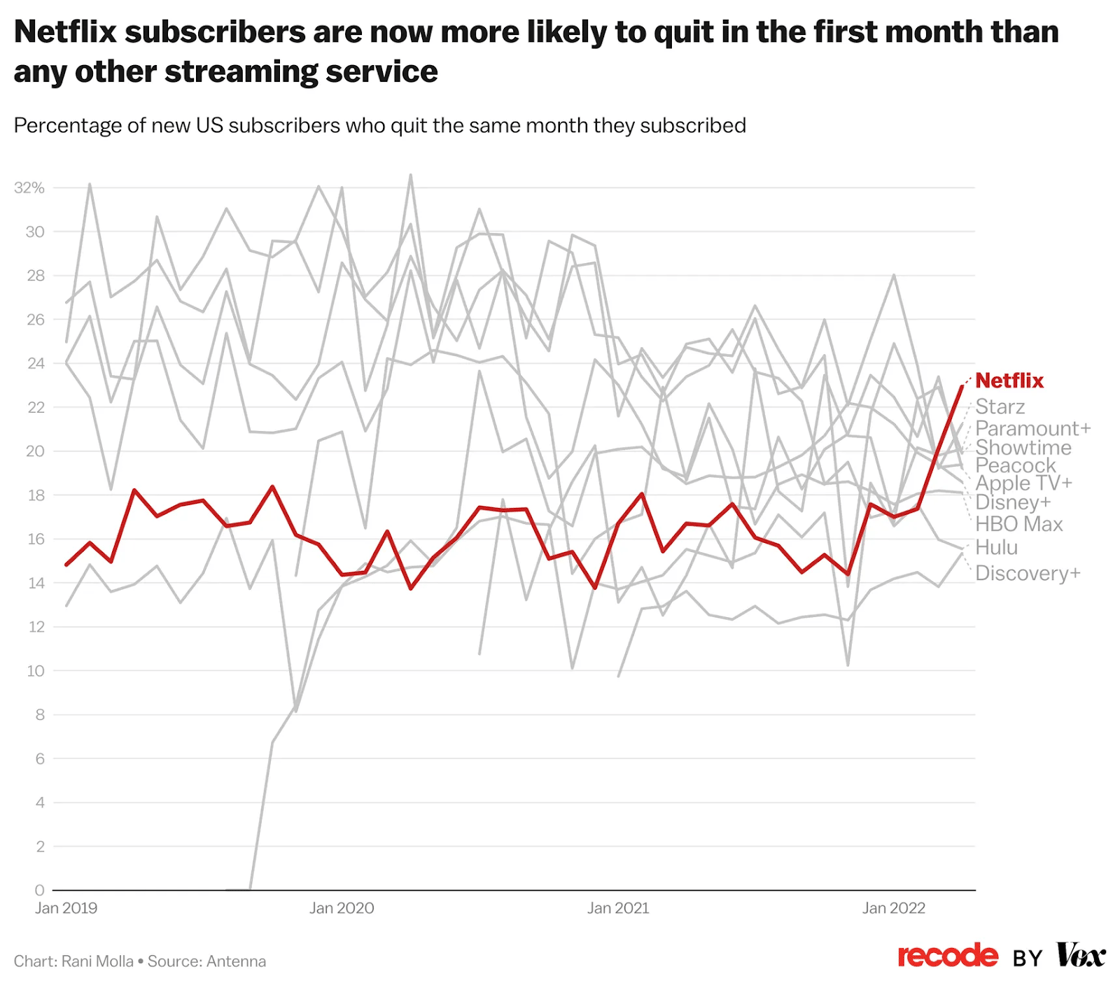
Interesting #2: Netflix has the highest cancellation rate of any streaming service for subscribers in their first month.
Big question #4: Are people watching less Netflix?
Quick answer: No. Netflix accounted for the largest share of minutes viewed for any network and grew its share of total TV time by 13% (6.0% → 6.8%).
Top networks by total minutes viewed according to Nielsen:
1) Netflix – 1.3T
2) CBS – 752.8B (924B)
3) NBC – 596.7B (804B)
4) ABC – 471.9B (759B)
5) Fox – 323.1B (575B)
6) Disney+ – 245.4B
7) Prime Video – 173.7B
8) Hulu – 128.1B
9) Apple TV+ – 21.7B
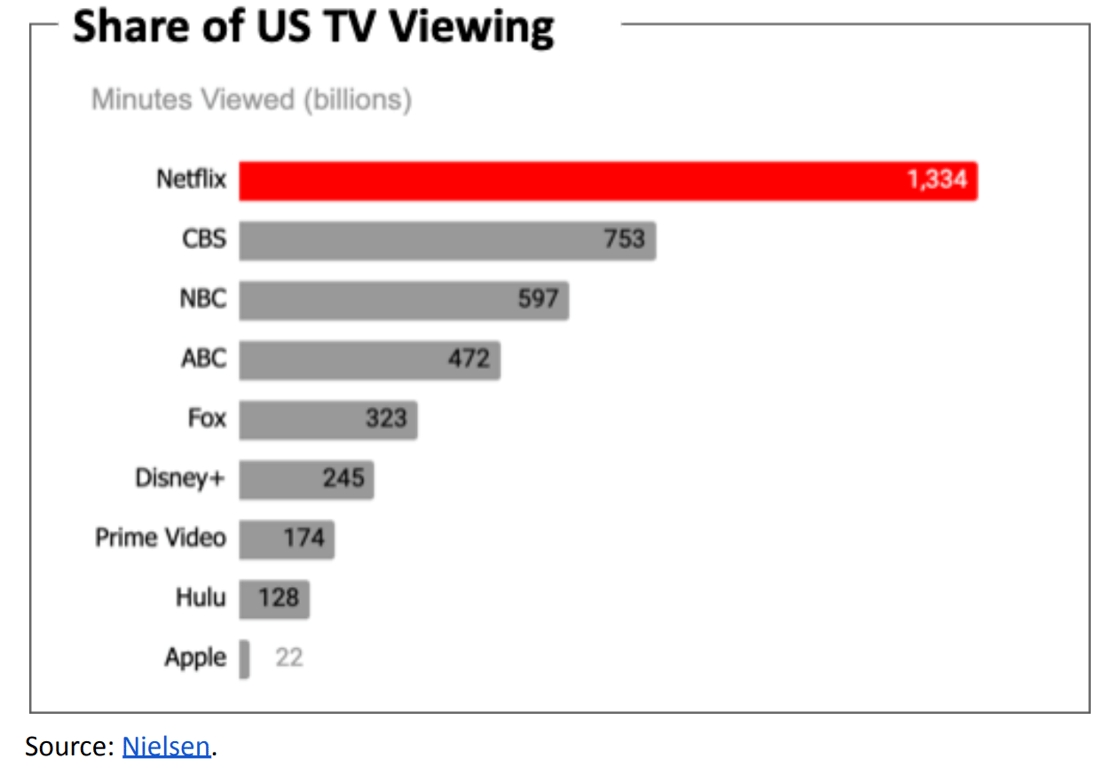
h/t: Michael Mulvihill @ Fox Sports posted the numbers with local affiliate viewership included.
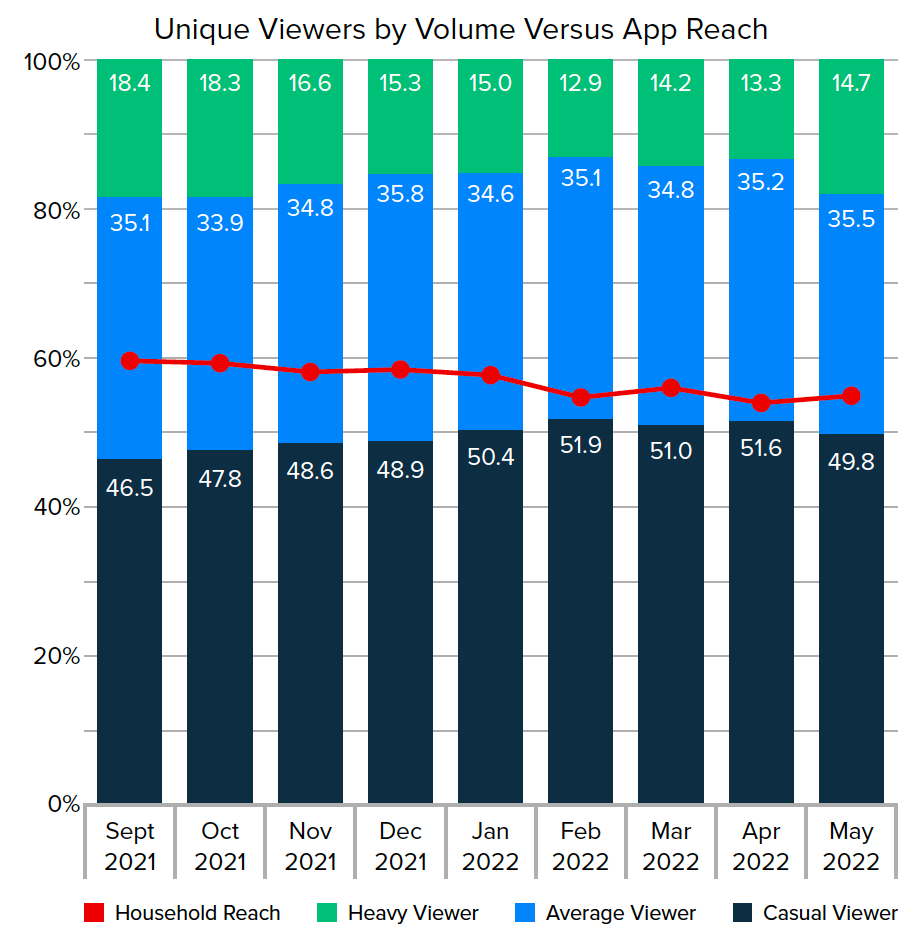
Interesting: TVision data shows Netflix gaining heavy/average viewers and losing casual viewers.
Big question #5: Is revenue for Netflix declining?
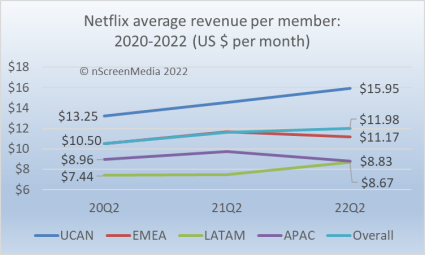
Quick answer: No. YoY revenue grew 9%.
Netflix growth between 2022-Q1 and 2022-Q2:
1) Subscribers – ↓ 0.4%
2) Share of TV time – ↑ 13.3%
3) Revenue – ↑ 1.3%
4) Revenue/Subscriber – ↑ 1.7%
Big question #6: When will Netflix launch ads?
Quick answer: Early 2023.
Quote from Tim Armstrong – CEO @ Flowcode:
“Netflix has probably the most valuable pool of inventory in the world of video advertising, which historically has been the most important area.”
Quick math on the Netflix ad model in the U.S. according to Jessica Toonkel:
1) ≈ 66M current subscribers
2) 10M new sign-ups for ad-supported tier
3) 30% of existing subscribers (20M) switch to an ad-supported tier
4) 30M ad-supported subscribers
5) $10/month subscription fee for ad-supported plan
6) $7/month in advertising revenue/subscriber
7) $17/month in total revenue/subscriber (ARPU)
Outstanding questions:
1) What ad units (pre-roll, mid-roll, etc.) will Netflix offer?
2) What share of their content will carry ads?
3) Will Netflix build the largest walled garden in video advertising?

