Six big questions re: cord cutting:
1) How many homes subscribe to a pay-TV bundle?
2) What share of pay-TV subscriptions are streaming?
3) How many homes currently subscribe to broadband?
4) Is broadband a better business than pay-TV?
5) Is time spent with cable declining at the same rate as subscribers?
6) What share of available channels do pay-TV subscribers watch?
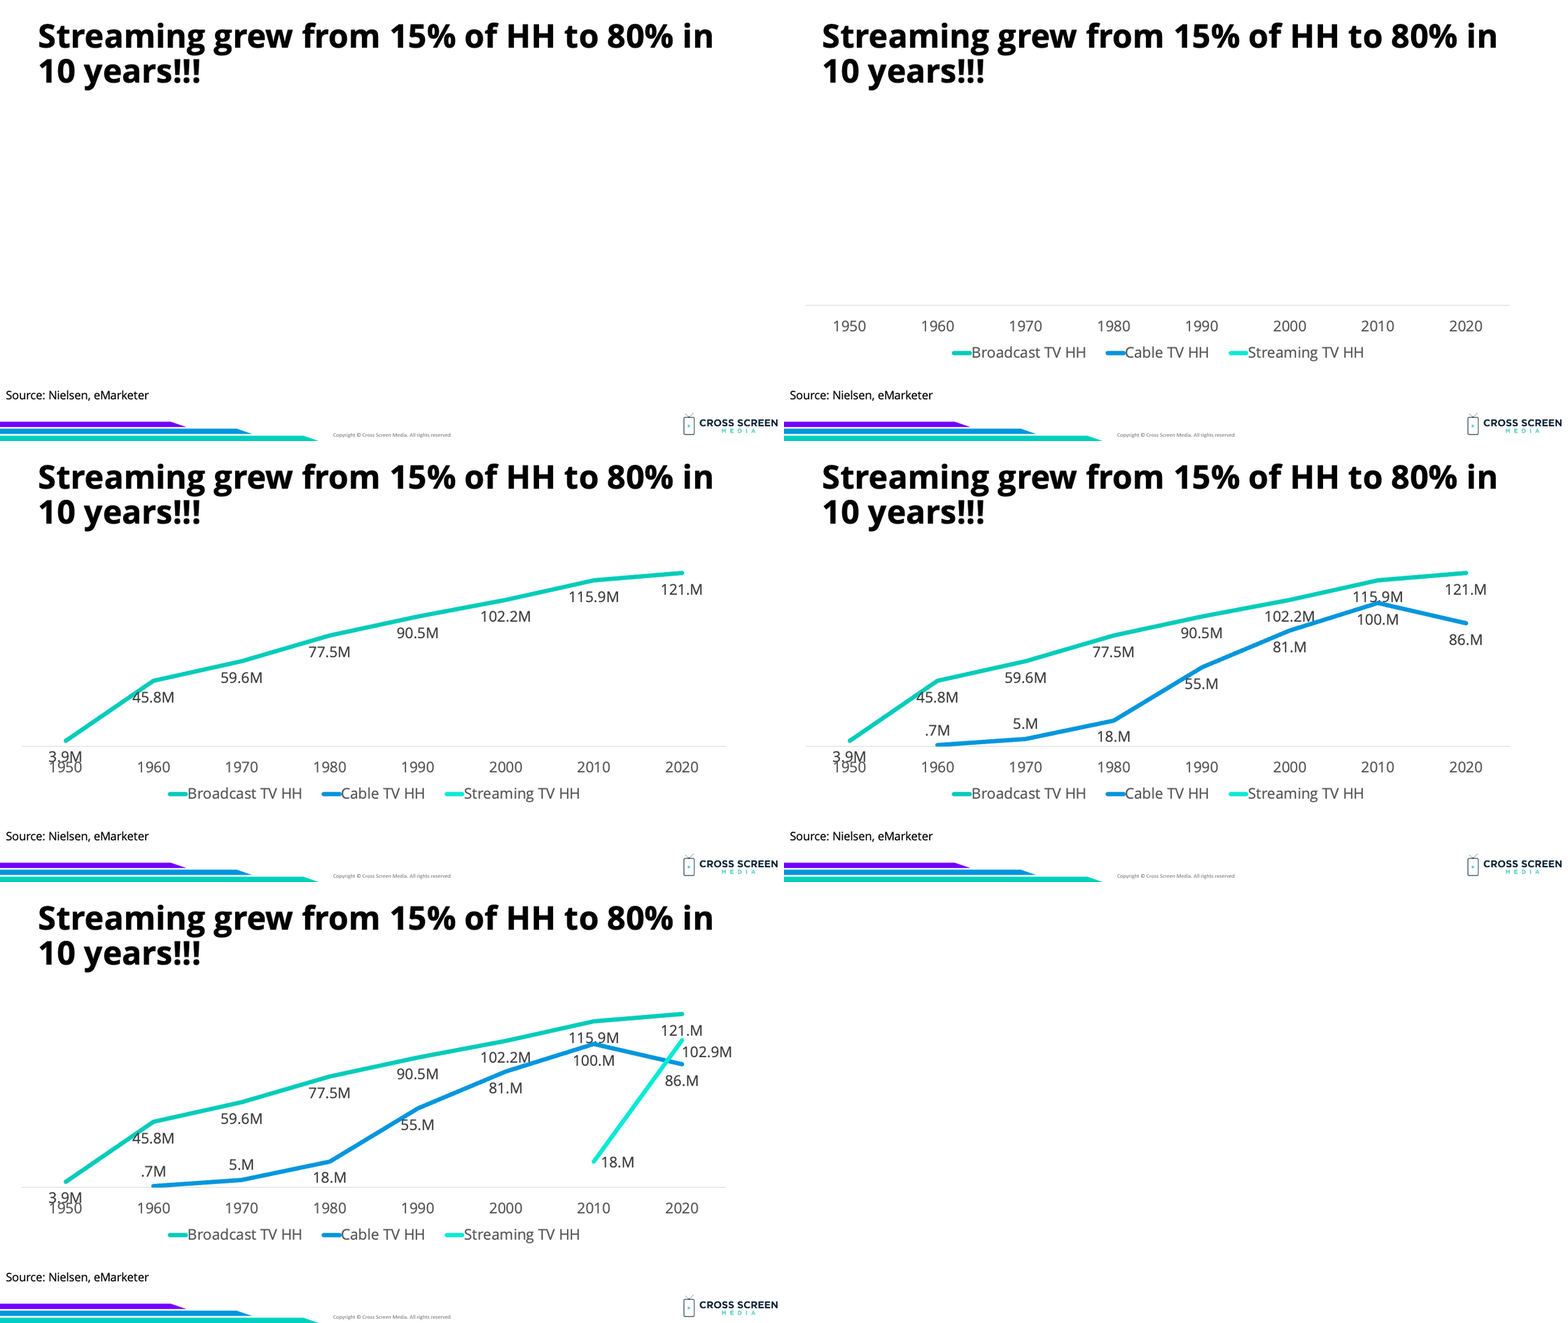
Setting the table: The chart below shows the HH growth for broadcast, cable, and streaming since 1950.
Big question #1: How many homes subscribe to a pay-TV bundle?
Quick answer: 76.0M
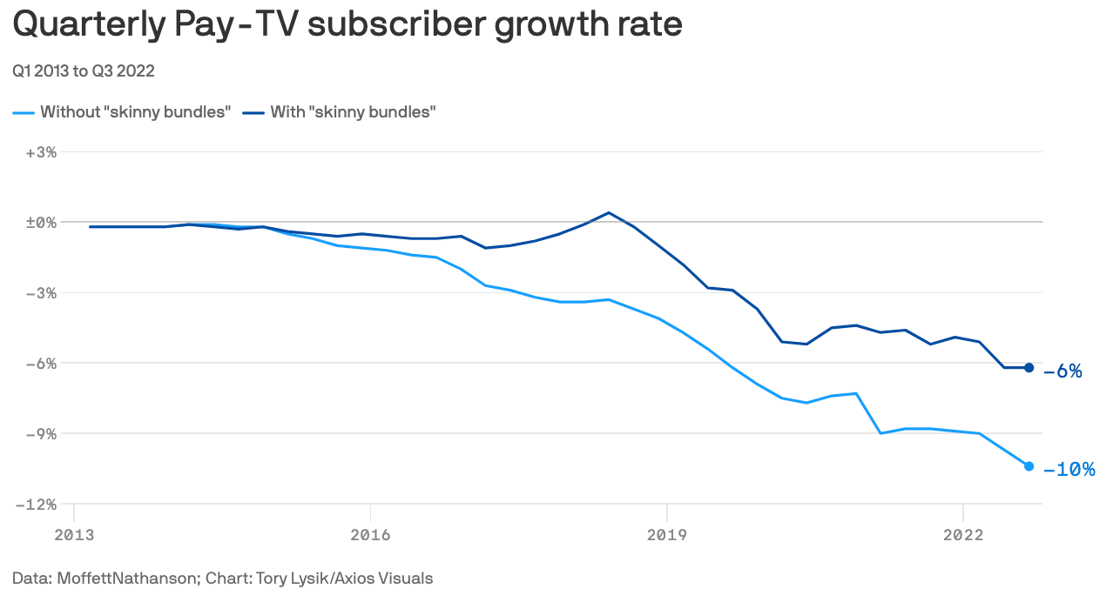
YoY change in pay-TV subscribers:
1) Traditional pay-TV – ↓ 6.3M
2) Streaming pay-TV – ↑ 1.6M
3) Total pay-TV – ↓ 4.7M
Total pay-TV subscriptions (YoY growth):
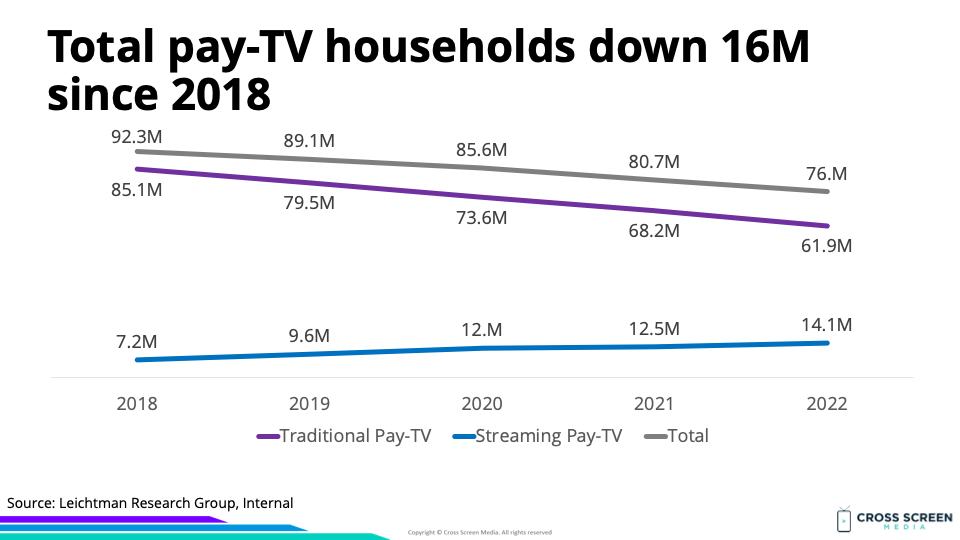
1) 2018 – 92.3M
2) 2019 – 89.1M (↓ 4%)
3) 2020 – 85.6M (↓ 4%)
4) 2021 – 80.7M (↓ 6%)
5) 2022 – 76.0M (↓ 6%)
 |
FYI: Household penetration for pay-TV has fallen to 1993’s level.
Big question #2: What share of pay-TV subscriptions are streaming?
Quick answer: 19%
Streaming pay-TV subscriptions (YoY growth):
1) 2018 – 7.2M
2) 2019 – 9.6M (↑ 33%)
3) 2020 – 12.0M (↑ 25%)
4) 2021 – 12.5M (↑ 4%)
5) 2022 – 14.1M (↑ 12%)
Streaming share of pay-TV subscribers:
1) 2018 – 8%
2) 2019 – 11%
3) 2020 – 14%
4) 2021 – 16%
5) 2022 – 19%
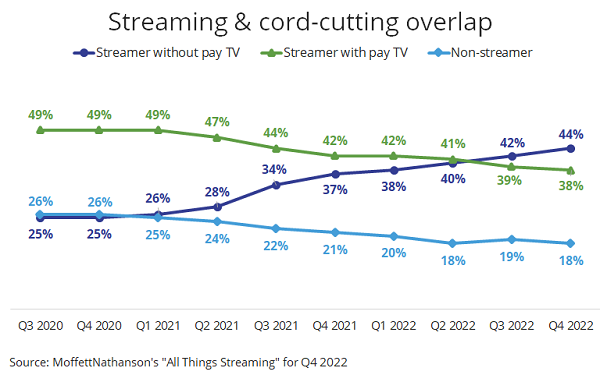
Share of U.S. TV households by source according to MoffettNathanson:
1) Streaming only – 44%
2) Streaming + Pay-TV – 38%
3) Non-streamer – 18%
Interesting: Colin Dixon at nScreenMedia has a similar chart (includes duplication).
Total U.S. TV households by source according to nScreenMedia:
1) Streaming (subscription) – 106M
2) Traditional pay-TV – 68M
3) Streaming (ad-supported) – 31M
4) Over-the-air – 19M
5) Streaming pay-TV – 15M
 |
Traditional pay-TV subscriptions (YoY growth):
1) 2018 – 85.1M
2) 2019 – 79.5M (↓ 7%)
3) 2020 – 73.6M (↓ 7%)
4) 2021 – 68.2M (↓ 7%)
5) 2022 – 61.9M (↓ 9%)
Big question #3: How many homes currently subscribe to broadband?
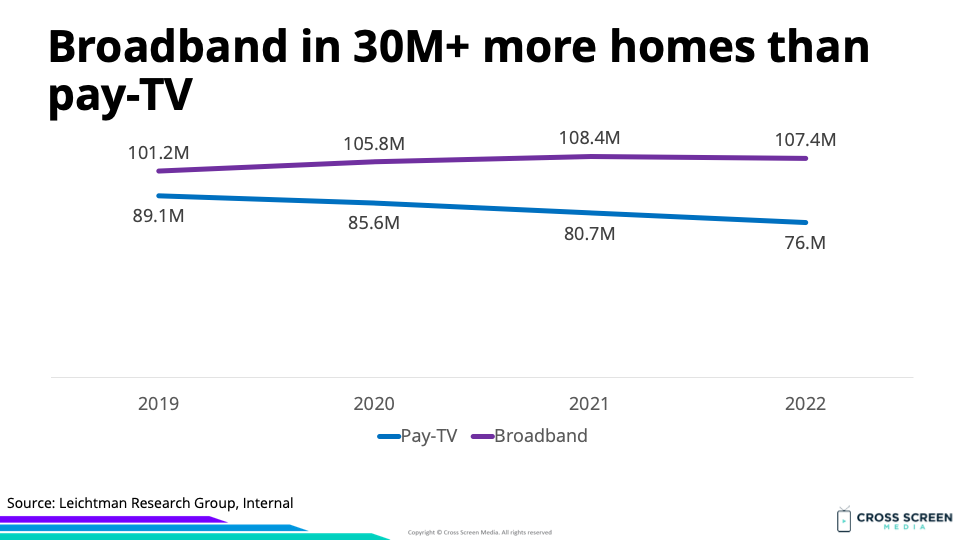
Total broadband subscriptions (YoY growth) according to Leichtman Research Group:
1) 2019 – 101.2M
2) 2020 – 105.8M (↑ 5%)
3) 2021 – 108.4M (↑ 2%)
4) 2022 – 107.4M (↓ 1%)
 |
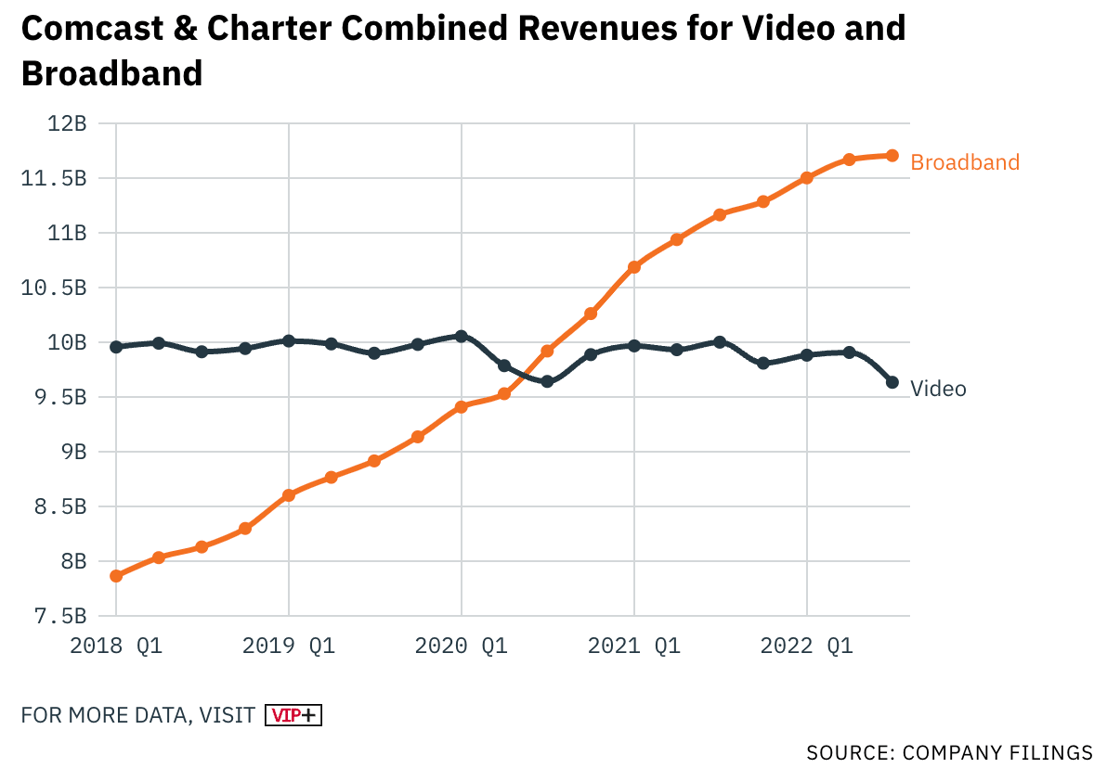
Big question #4: Is broadband a better business than pay-TV?
Quick answer: Yes. In 2022-Q3, Comcast/Charter generated $1.21 in broadband revenue for every $1.00 in pay-TV revenue.
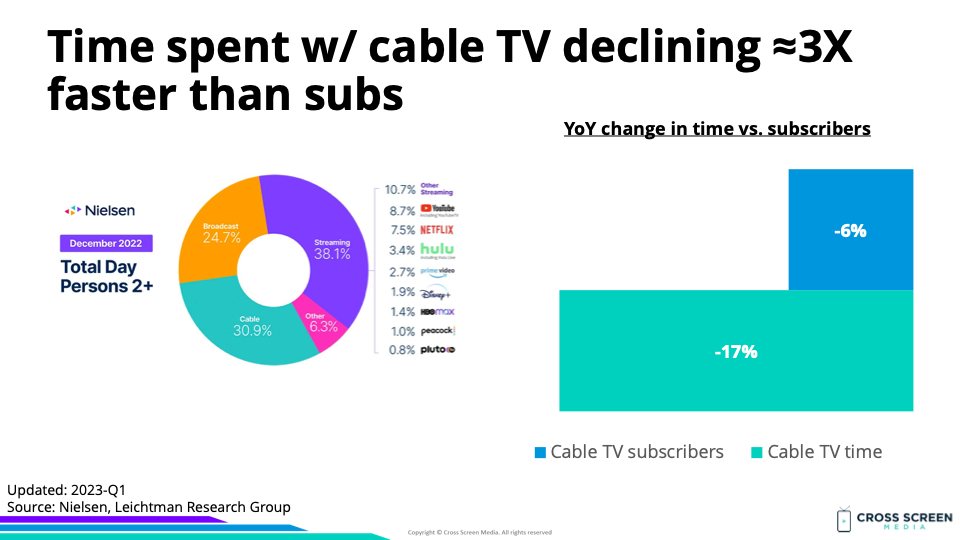
Big question #5: Is time spent with cable declining at the same rate as subscribers?
Quick answer: Yes. Time spent w/ cable TV declined ≈ 3X as fast as subscribers.
Why this matters: Consumers who watched low amounts of cable TV were obvious early targets for cord-cutting. Now consumers who watch an above-average amount of cable TV are cutting the cord.
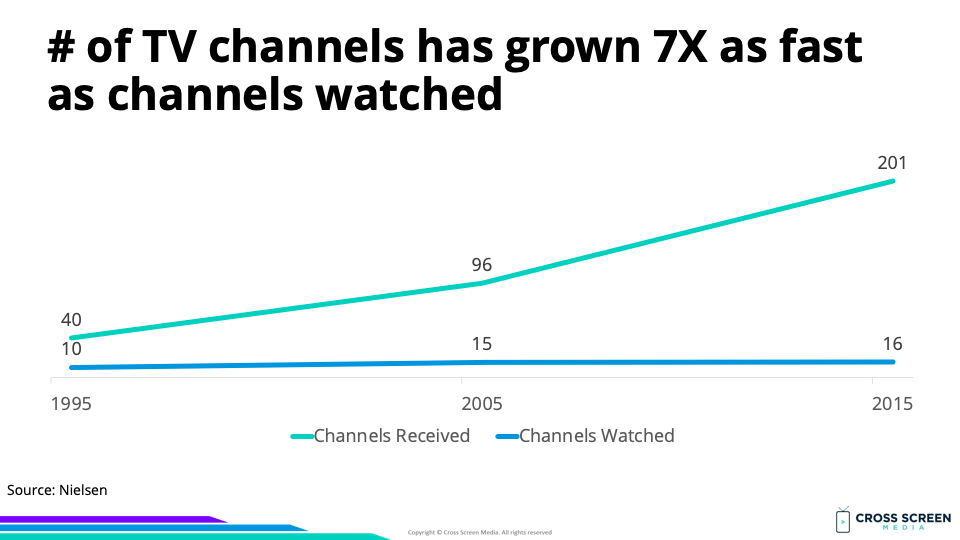 |
Why this matters: Pay-TV bundles become bloated with networks many people never watch but still pay for.
Three waves of disruption for the pay-TV ecosystem, according to Matthew Ball:
1) Wave #1 (2007 – 2015) – Pay-TV is getting better but too expensive. Better value substitutes emerge
2) Wave #2 (2015 – 2019) – Pay-TV is still getting better, plus cheaper. Better value substitutes are getting better
3) Wave #3 (2019 – Present) – Pay-TV is getting worse and more expensive. Suppliers focused on better value substitutes

