
Worth your time: Antenna has released another must-read report breaking down the U.S. streaming market. (h/t: Brendan Brady)
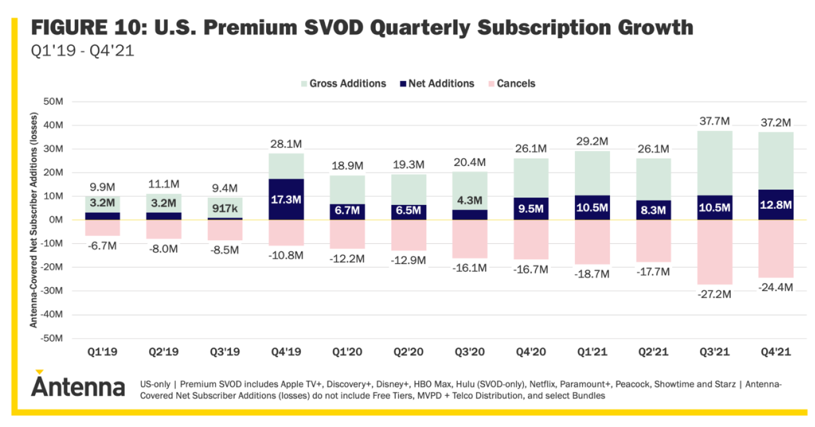
Big news: Streaming video services added 42M net new paid U.S. subscribers in 2021.
Net new paid U.S. streaming subscribers (YoY growth) according to Antenna:
1) 2019 – 24.7M
2) 2020 – 26.9M (↑ 9%)
3) 2021 – 42.2M (↑ 57%)
Big question #1: Which streaming service had the highest share of net new subscribers?
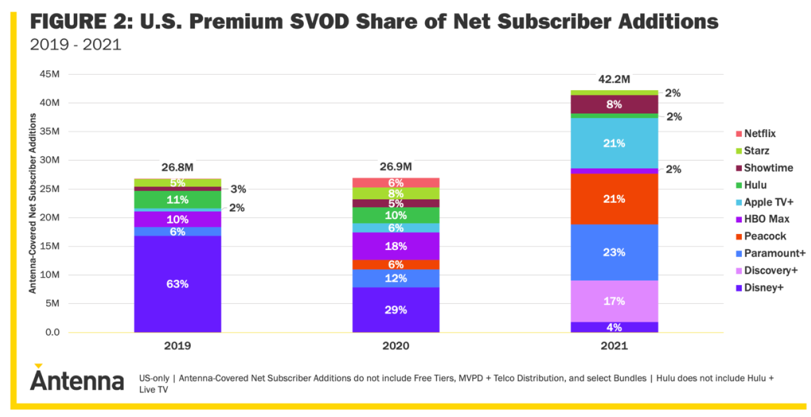
Share of net new paid U.S. streaming subscribers in 2021:
1) Paramount+ – 23%
2) Peacock – 21%
3) Apple TV+ – 21%
4) Discovery+ – 17%
Big question #2: What event drove the most new subscribers?
Quick answer: The Super Bowl added ≈ 800K new subscribers for Paramount+.
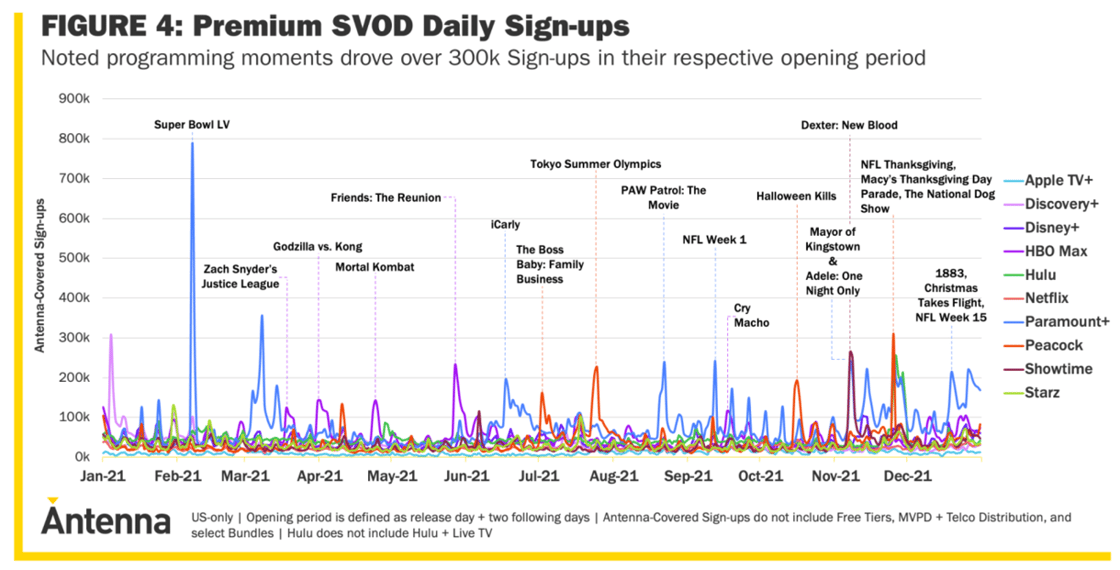
What Toddler Screens is (still) watching: Paramount+ adds the Paw Patrol movie and we sign up that day.
Big question #3: How many subscribers cancel their service each month?
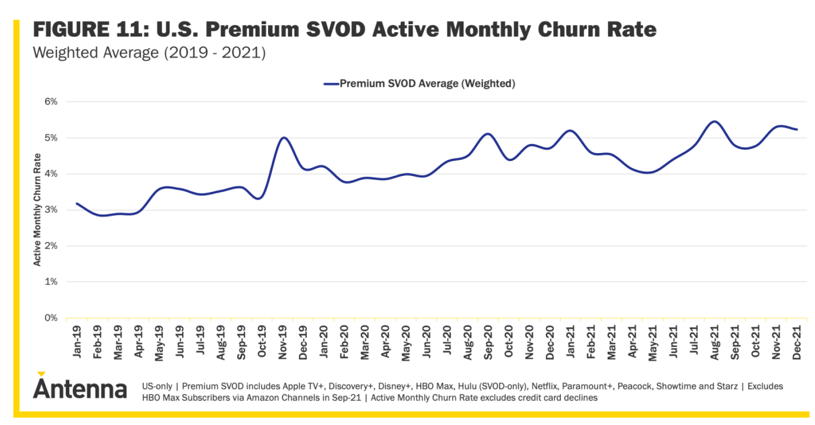
Average monthly churn rate (YoY growth):
1) 2019 – ≈ 3.5%
2) 2020 – ≈ 4.3% (↑ 22%)
3) 2021 – ≈ 4.8% (↑ 11%)
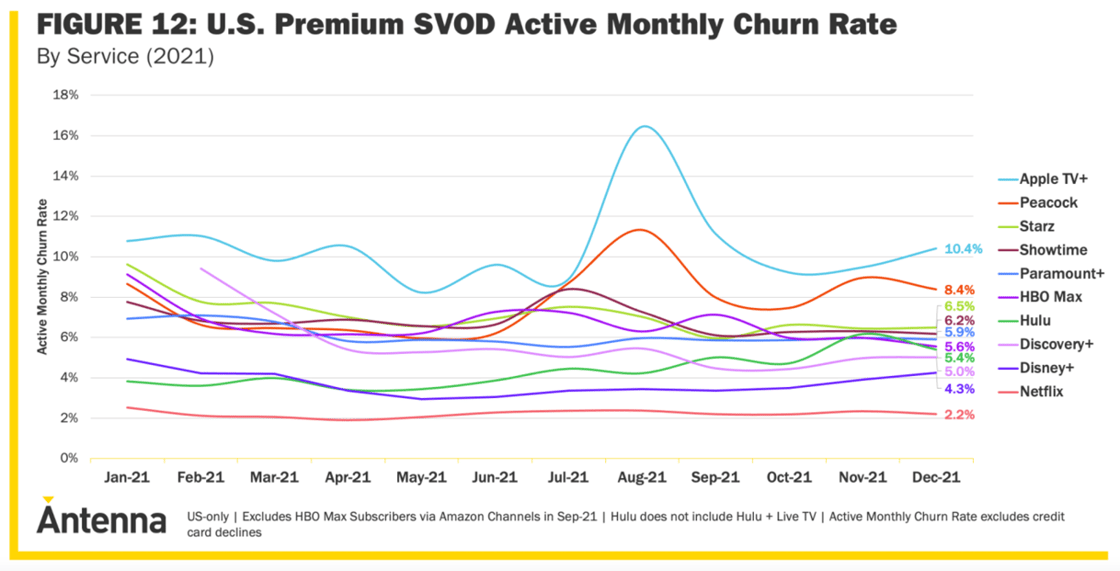
Big question #4: Which streaming services have the lowest churn rate?
Average monthly churn rate in 2021 by streaming service:
1) Netflix – 2.2%
2) Disney+ – 3.7%
3) Hulu – 4.3%
4) Average – 4.8%
5) Discovery+ – 5.6%
6) Paramount+ – 6.1%
7) HBO Max – 6.7%
8) Showtime – 6.8%
9) Starz – 7.1%
10) Peacock – 7.7%
11) Apple TV+ – 10.5%
More #1: Streaming measurement company Antenna raises $10 million
More #2: A startup that tracks streaming subscriptions broke down how the US market shifted in the last year.


