Setting the table: This is the 11th part of our Road to the White House series.
1) 11 Billion Reasons to Care About Political Video Ads
2) The Battle for Iowa (Part 1)
3) The Battle for Iowa (Part 2)
4) The Battle For New Hampshire
5) Is Biden Reaching Enough Swing Voters?
6) Biden vs. Trump I
7) The GOP Convention
8) The Race to Define Kamala Harris
9) The DNC Convention
10) Trump vs. Harris I
11) How We Vote
Eight big questions re: how we vote:
1) How many people will vote?
2) Which states turn out at the highest rate?
3) How do people vote?
4) When do people vote?
5) How often do people vote?
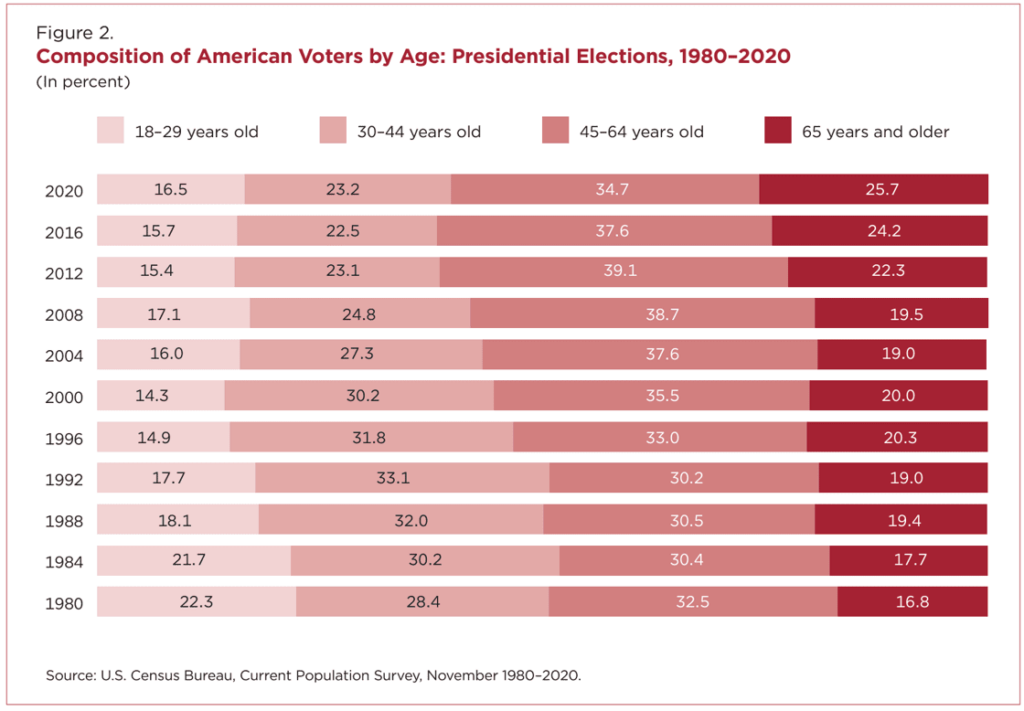
6) What share of votes comes from each age group?
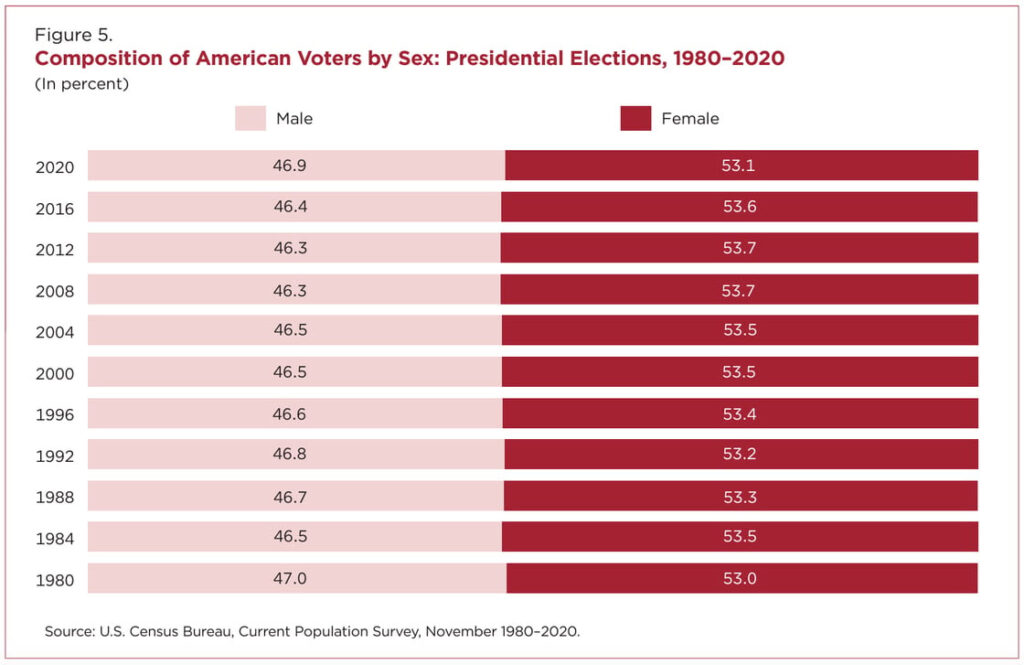
7) What share of votes comes from each gender?
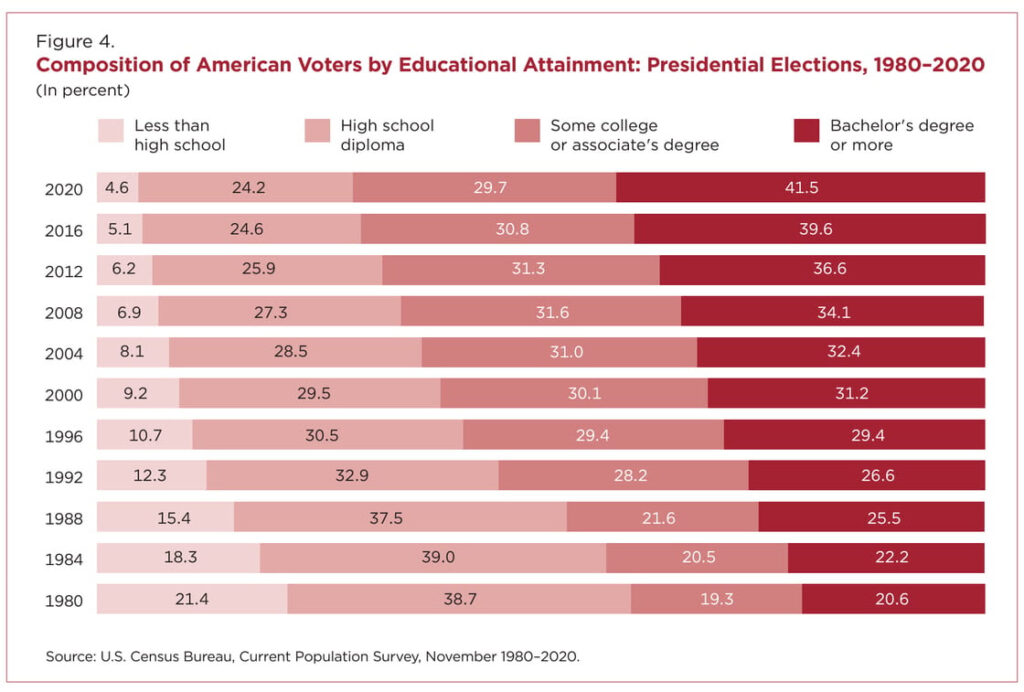
8) What share of votes comes from each education level?
Big news: 888K people have already voted in the 2024 election.
Big question #1: How many people will vote?
Quick answer: ≈ 153M
Quick math on winning the popular vote in 2024:
1) 244M Americans who are eligible to vote
2) 63.9% projected turnout (2016/2020 average)
3) 153M voters turnout
4) 76,738,001 votes to win the popular vote (50% + 1)
Reminder: Roughly 7 states will decide the electoral college. Those states contain 18% of the U.S. population.
Presidential elections with the highest voter turnout since 1900, according to the U.S. Election Project:
1) 1900 – 73.7%
2) 2020 – 66.6%
3) 1908 – 65.7%
4) 1904 – 65.5%
5) 1960 – 63.8%

Big question #2: Which states turn out at the highest rate?
States with the highest voter turnout in 2020, according to Wikipedia:
1) Minnesota – 79.2%
2) Colorado – 76.7%
3) Oregon – 75.3%
4) Washington – 75.3%
5) Wisconsin – 75.0%
States with the lowest voter turnout in 2020:
1) Oklahoma – 54.4%
2) Hawaii – 55.4%
3) Arkansas – 56.2%
4) West Virginia – 57.2%
5) Tennessee – 59.2%
Big question #3: How do people vote?
Voting method in the 2020 election according to the U.S. Census Bureau:
1) Early by Mail – 43%
2) Election Day – 31%
3) Early in Person – 26%

Share of voters who cast ballots early:
1) 1996 – 11%
2) 2000 – 14%
3) 2004 – 21%
4) 2008 – 31%
5) 2012 – 33%
6) 2016 – 40%
7) 2020 – 69%

Early voting share in the 2022 election:
1) Arizona – 82%
2) Nevada – 78%
3) Georgia – 64%
4) North Carolina – 58%
5) Michigan – 42%
6) Wisconsin – 28%
7) Pennsylvania – 23%

Big question #4: When do people vote?
Share of overall vote by day in the 2022 election according to Cross Screen Media:
1) 30 days out – 1%
2) 25 – 3%
3) 20 – 7%
4) 15 – 14%
5) 10 – 26%
6) 5 – 39%

Big question #5: How often do people vote?
Share of voters over the past three elections (2018-22), according to Pew:
1) 37% voted in all three
2) 30% did not vote
3) 16% voted in 2020 and either 2018/2022
4) 12% voted in 2020 only
5) 5% voted in 2018/2022, but not 2020

Big question #6: What share of votes comes from each age group?
Share of voters in the 2020 election by age group:
1) 45-64 – 35%
2) 65+ – 26%
3) 30-44 – 23%
4) 18-29 – 17%

Turnout rate in 2020 by age group:
1) 65+ – 75%
2) 45-64 – 71%
3) 30-44 – 64%
4) 18-20 – 54%
Why this matters: Older voters turnout at a higher rate than younger age groups. The age group with the highest turnout was 78-year-olds, at 80%. A 78-year-old was twice as likely to vote as an 18-year-old (42%).
Big question #7: What share of votes comes from each gender?
Share of voters in the 2020 election by gender:
1) Female – 53%
2) Male – 47%

Turnout rate in 2020 by gender:
1) Female – 68%
2) Male – 65%
Why this matters: Females make up a larger share of the population (52%) and vote at a higher rate leading to a 53% share of votes.
Big question #8: What share of votes comes from each education level?
Share of voters in the 2020 election by education:
1) Bachelor’s degree – 42%
2) Some college – 30%
3) High school diploma – 24%
4) Less than high school – 5%


