Eight big questions re: hockey + local TV:
1) Who are the favorites to win the Stanley Cup?
2) How many people watch NHL games?
3) What does an NHL fan look like?
4) What is different about watching NHL games this season?
5) What share of revenue comes from local TV?
6) What makes the Dallas Stars offering unique?
7) What does success look like for the Dallas Stars?
8) Why will this work?
Big question #1: Who are the favorites to win the Stanley Cup?
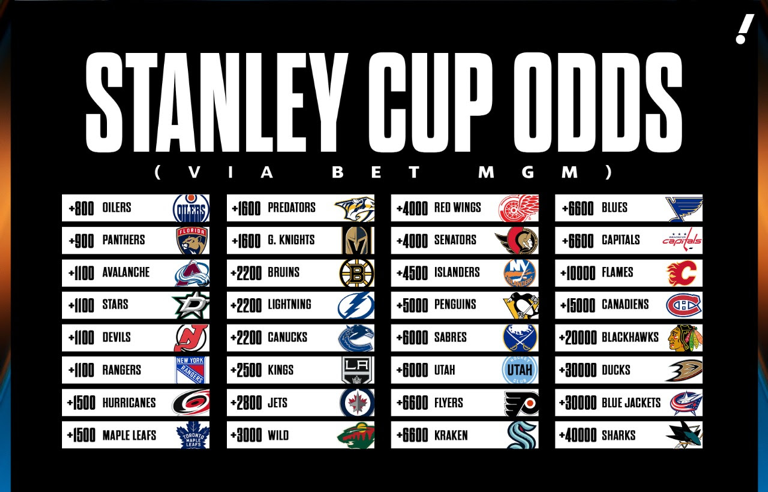
Favorites to win the Stanley Cup according to Bet MGM:
1) Edmonton Oilers
2) Florida Panthers
3) Colorado Avalanche
4) Dallas Stars
5) New Jersey Devils
Big question #2: How many people watch NHL games?
NHL average regular season viewership (YoY change) according to Sports Business Journal:
1) 2016-17 – 474K
2) 2017-18 – 417K (↓ 12%)
3) 2018-19 – 424K (↑ 2%)
4) 2019-20 – 398K (↓ 6%)
5) 2020-21 – 391K (↓ 2%)
6) 2021-22 – 460K (↑ 18%)
7) 2022-23 – 465K (↑ 1%)
8) 2023-24 – 504K (↑ 8%)
Big question #3: What does an NHL fan look like?
Share of NHL fans by age according to S&P:
1) 18-24 – 8%
2) 25-34 – 18%
3) 35-49 – 25%
4) 50-64 – 26%
5) 65+ – 23%
Share of NHL fans by income:
1) < $50K – 38%
2) $50K-$100K – 33%
3) $100K+ – 26%
4) N/A – 3%
Big question #4: What is different about watching NHL games this season?
Quick answer: All hell has broken loose as the regional sports network (RSN) model has collapsed. The NHL’s 32 teams have splintered their local TV rights into four directions:
1) RSN model through a pay-TV bundle
2) Some free broadcasts combined with a subscription streaming service
3) All free broadcasts
4) All free streaming
Why this matters: Bally Sports may reduce payments to NHL teams by as much as 65% this season.
Big question #5: What share of revenue comes from local TV?
Share of revenue from local TV according to Sportico:
1) MLB – 23%
2) NBA – 13%
3) NHL – 12%
4) NFL – 1%
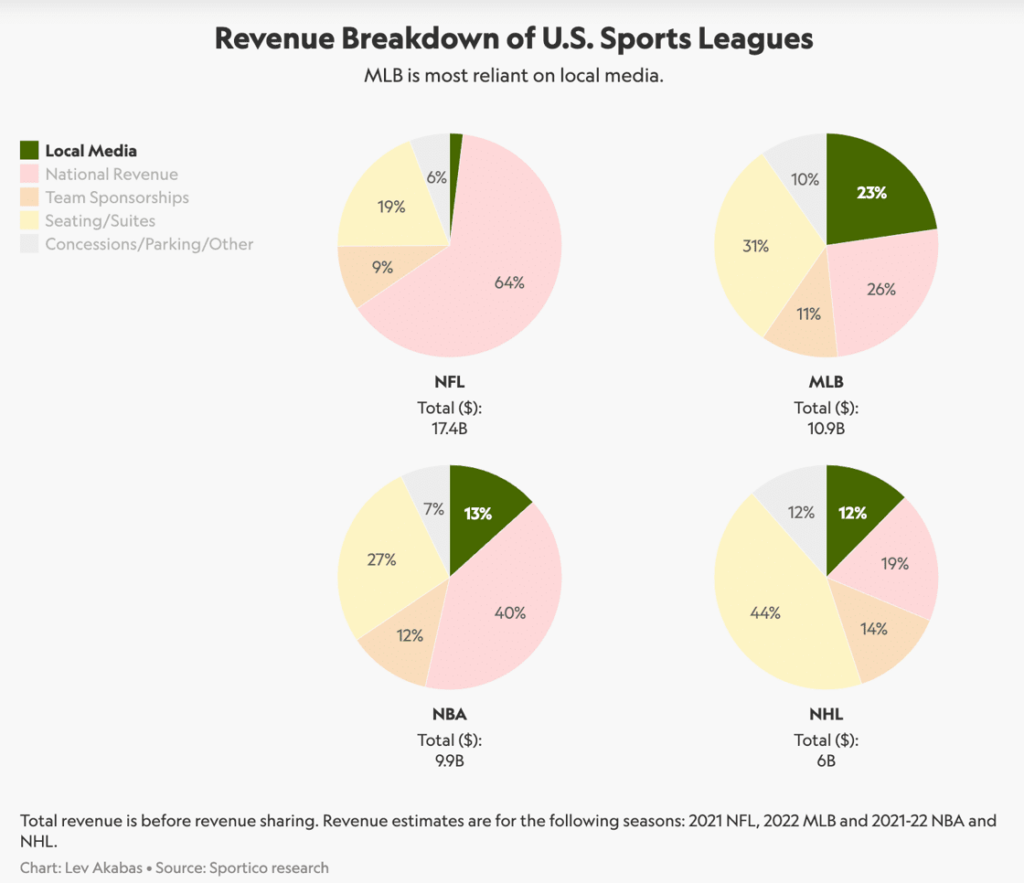
Bottom line: The majority of teams could see 12% of their revenue disappear overnight.
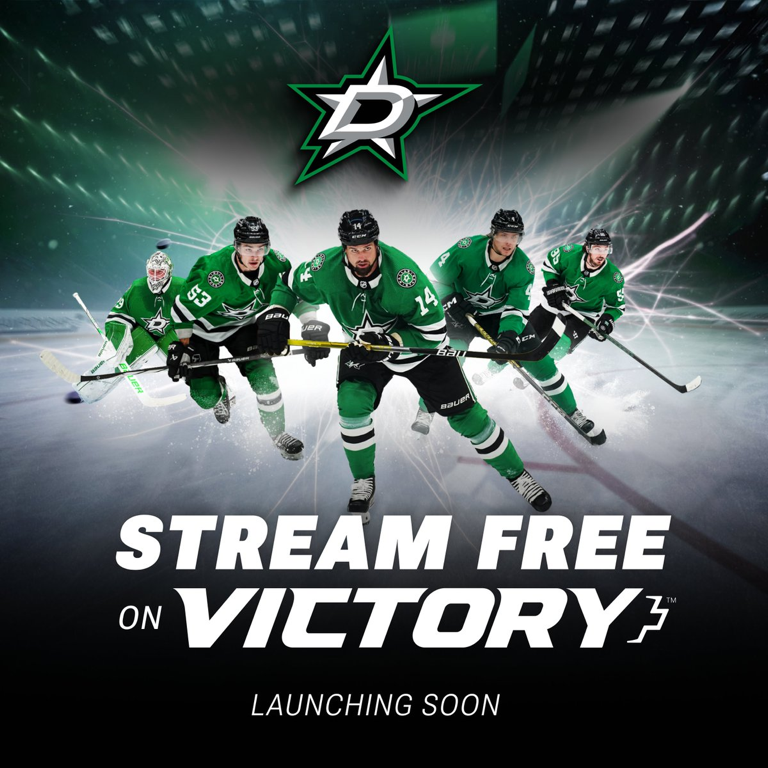
Big question #6: What makes the Dallas Stars offering unique?
Quick answer: The Dallas Stars are the first team to stream their local games for free (Victory+).
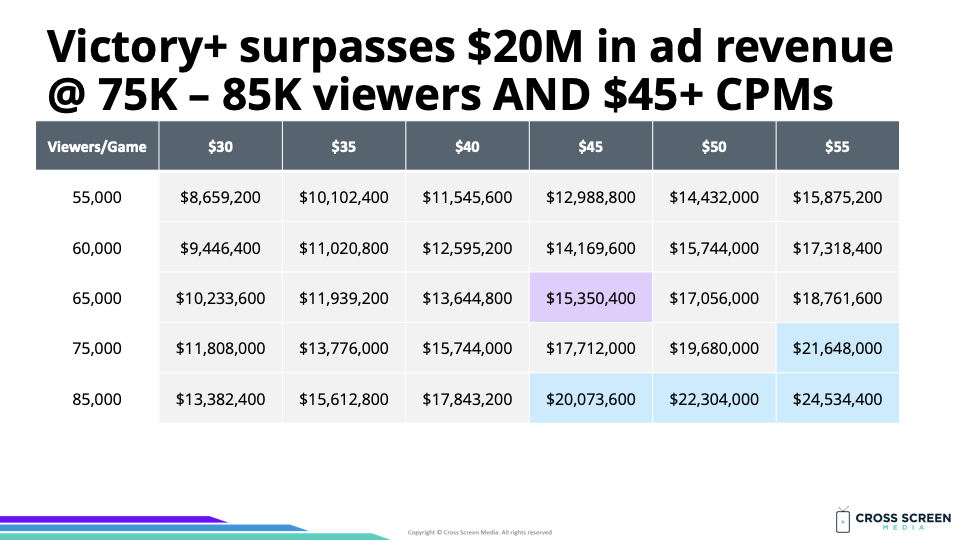
How this will work: The Dallas Stars will attempt to replace the fee paid by Bally Sports ($20M) through advertising. The team entered into a 7-year partnership with A Parent Media Co. (APMC), who will take the lead on the streaming tech.
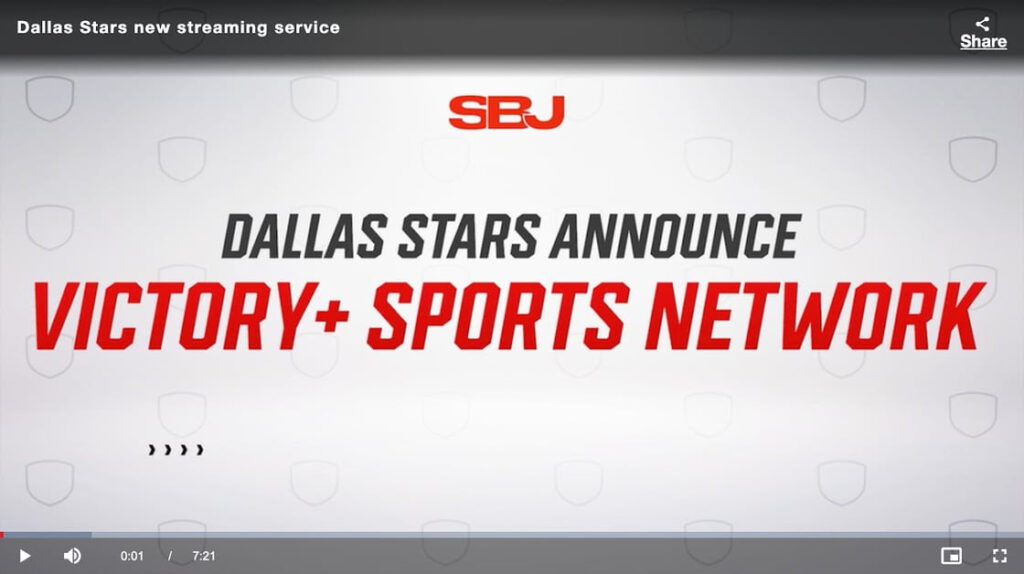
Video: Stars’ Brad Alberts talks team’s new Victory+ streaming service
Quote from Brad Alberts – CEO @ the Dallas Stars:
“We feel like direct-to-consumer is the future for local sports, certainly, and we’re ripping the band-aid off and going there. ‘We’ll take the [RSN] money as long as it’s there and stay consistent with what we’ve been doing for the last 20 years.’ But we made the decision and finally said, ‘You know what? Enough’s enough. Let’s get out of this. Let’s control our own destiny and not be tied to this thing anymore.”
Interesting: 96% of the Dallas Stars’ fanbase already watches ad-supported streaming.
Share of fans who watch ad-supported streaming according to S&P:
1) Dallas Stars – 96%
2) NHL – 86%
Big question #7: What does success look like for the Dallas Stars?
Quick answer: The Victory+ offering needs to nail three goals:
1) Fans need to download the app
2) Fans need to watch the games
3) Victory+ needs to sell the ad space
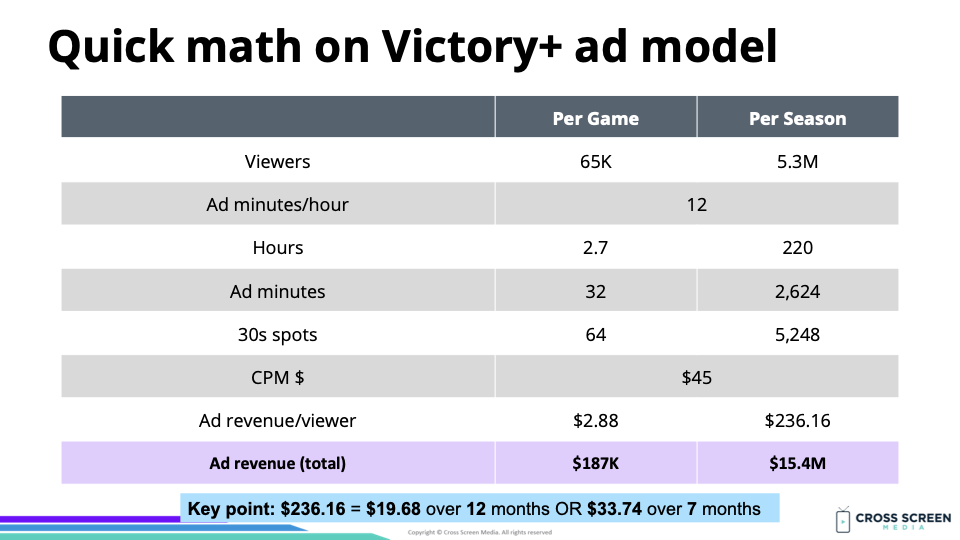
Quick math on the advertising model for Victory+:
1) Games/year – 82
2) Viewers/game – 65K
3) 30s spots/hour – 24
4) Hours/game – 2.7
5) 30s spots/game – 64
6) CPM $ – ≈ $45
7) Ad revenue/game – $187K
8) Ad revenue/season – $15.4M
9) Ad revenue/viewer/season – $236
Big question #8: Why will this work?
Mr. Screen’s Crystal Ball: Victory+ will exceed expectations and become the playbook for teams moving forward. It combines the most in-demand content (live sports) with the best form of TV advertising (streaming). Unlike the RSN model, the worst day is today and the economics should improve as time goes on.
Quote from John Cassillo – Head of Analytics & Trend Reporting @ Fabric Media:
“The math has clearly changed toward wider availability bringing in more money from ads — instead of a subscriber fee-focused model.”
Quick math #1: More app downloads = more viewers = more ad impressions = more revenue
Quick math #2: More advertisers = more demand = higher CPMs = more revenue
Quick math #3: More targeting/measurement = higher CPMs = more revenue
Quote from Wim Sweldens – Co-founder and CMO @ Kiswe:
“The experience we provide isn’t fundamentally different [from a linear broadcast], but we can include programmatic ads. The ad break isn’t fundamentally different, but the tech is different. There is a much larger opportunity looming [for advertisers].”
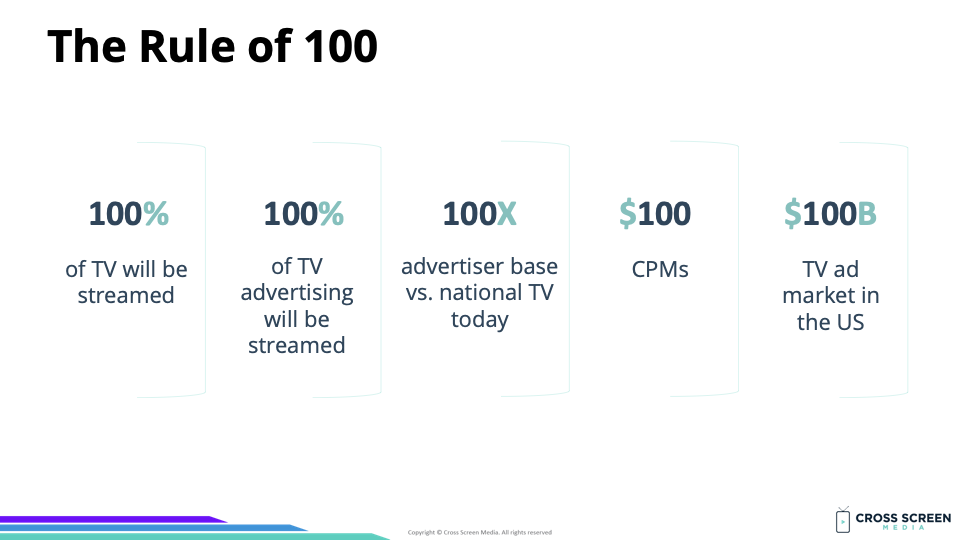
The rule of 100: One of our three primary frameworks from the book was around the impact of matching TV ad inventory (valuable) with all video advertisers (100X larger).
1) 100% of TV will be streamed
2) 100% of TV advertising will be streamed
3) 100X advertiser base vs. national TV today
4) $100 CPMs
5) $100B TV ad market in the US
Flashback: Now Streaming: The Future of Local TV is Here
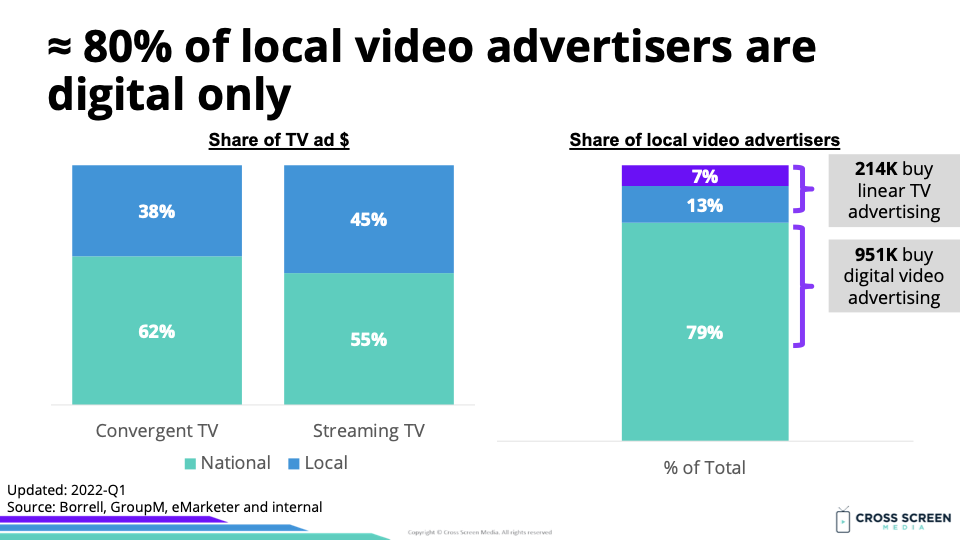
Bottom line: 80% of local video advertisers are digital-only and advertise on platforms like Facebook/Instagram and Google. Because 1M advertisers compete in an auction for every ad impression, these platforms can command high CPMs for less valuable inventory.
More: PMG Partners With Dallas Stars & Victory+ on Innovative, Free, Ad-Supported Streaming Service

