Seven big questions re: Peacock:
1) How much revenue is Comcast generating from Peacock?
2) How many subscribers do they have?
3) What share of ad-supported streaming subscribers does Peacock account for?
4) What share of revenue does advertising account for?
5) How much is Peacock charging for advertising?
6) What share of total TV time does Peacock account for?
7) How much does Comcast spend on content?
Big question #1: How much revenue is Comcast generating from Peacock?
Peacock revenue (YoY growth) according to Kagan:
1) 2021-Q3 – $230M
2) 2022-Q3 – $506M (↑ 120%)
3) 2023-Q3 – $830M (↑ 64%)
Peacock profit (YoY growth):
1) 2021-Q3 – –$519M
2) 2022-Q3 – –$614M (↓ 18%)
3) 2023-Q3 – –$566M (↑ 8%)

FYI: Peacock has lost $6B+ since 2021.
Big question #2: How many subscribers do they have?
Peacock subscribers (YoY growth):
1) 2020-Q3 – 3.0M
2) 2021-Q3 – 8.1M (↑ 170%)
3) 2022-Q3 – 15.0M (↑ 85%)
4) 2023-Q3 – 28.0M (↑ 87%)

Big question #3: What share of ad-supported streaming subscribers does Peacock account for?
Quick answer: With ≈ 26% of all ad-supported streaming subscribers, Peacock is the 2nd largest in the U.S.

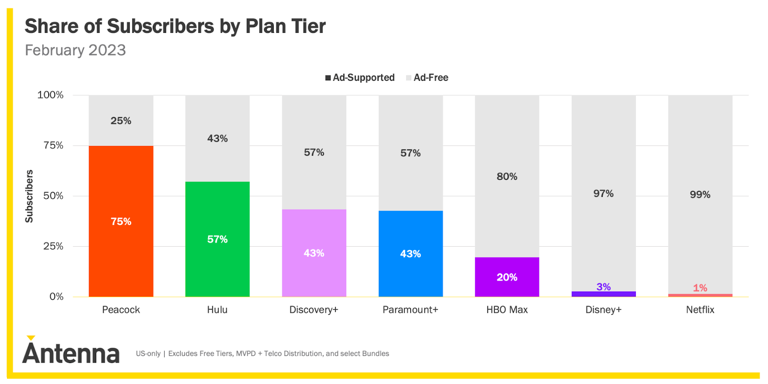
Why this matters: Peacock is in a strong position to build a massive ad business since 75% of their subscribers are already on an ad-supported plan vs. 1% – 3% for Disney+/Netflix.

Big question #4: What share of revenue does advertising account for?
Quick answer: 43%
Peacock advertising revenue (YoY growth) according to Kagan:
1) 2021-Q3 – $109M
2) 2022-Q3 – $255M (↑ 134%)
3) 2023-Q3 – $355M (↑ 39%)
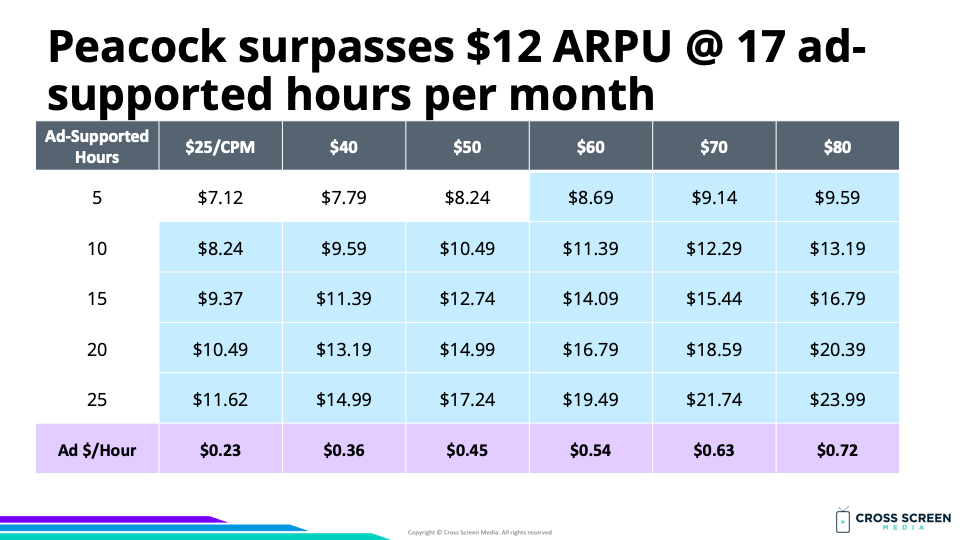
Quick math on the advertising model for Peacock:
1) Ad minutes/hour – 4.5
2) 30s spots/hour – 9
3) CPM $ – ≈ $40
4) $/spot – $0.04
5) Ad revenue/hour – $0.36
6) ARPU > $12 @ 17 hours ($6.00 + $6.12 = $12.12)

Big question #5: How much is Peacock charging for advertising?
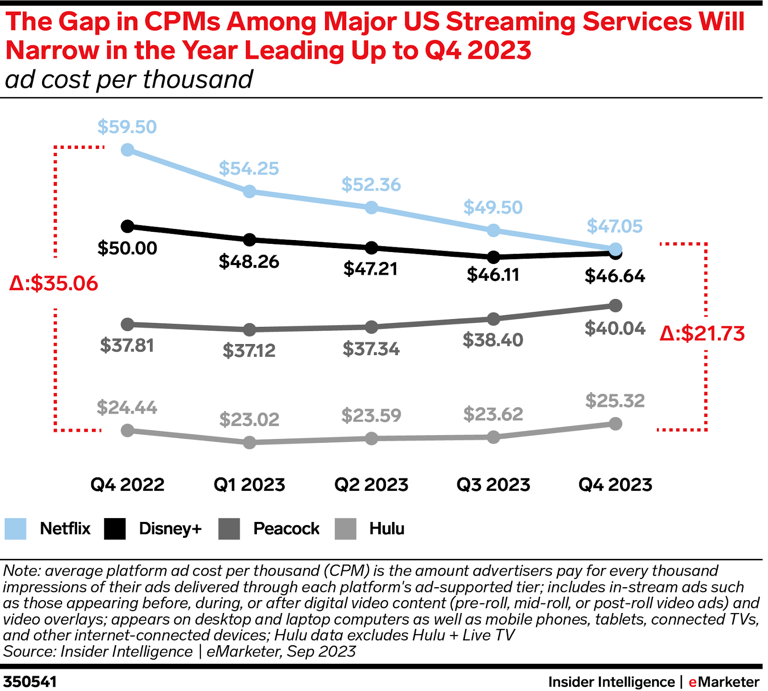
Quick answer: ≈ $40 CPM

Big question #6: What share of total TV time does Peacock account for?
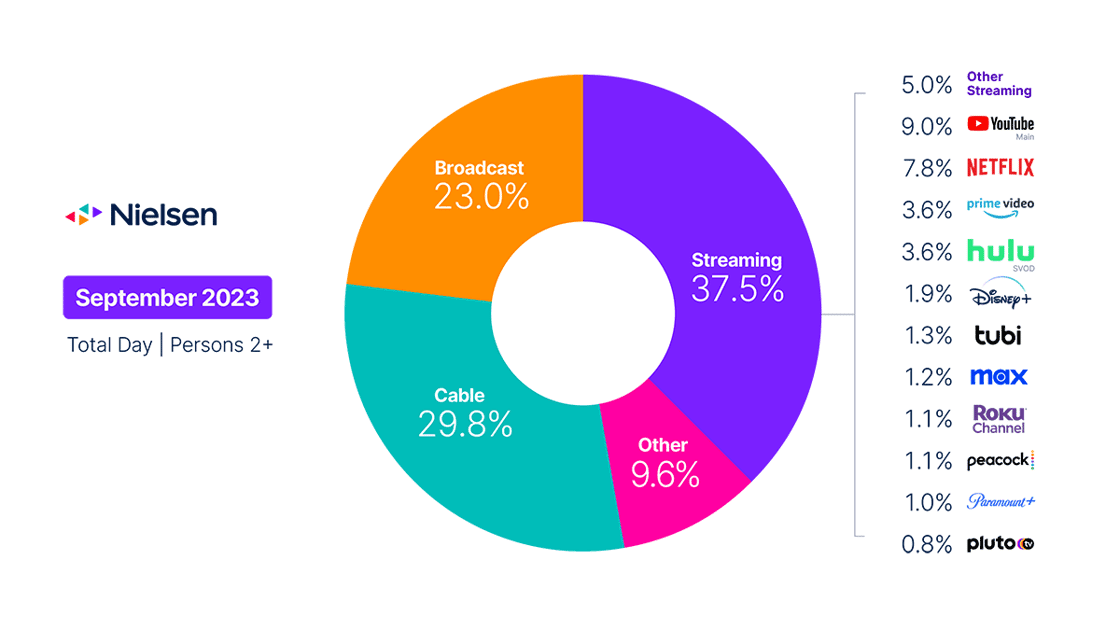
Quick answer: Peacock accounts for 1% of total TV time and 3% of streaming TV time.

Big question #7: How much does Comcast spend on content?
Estimated U.S. content spend for Comcast(YoY growth) according to Wells Fargo:
1) 2019 – $21B
2) 2020 – $20B (↓ 5%)
3) 2021 – $25B (↑ 25%)
4) 2022 – $26B (↑ 4%)
5) 2023P – $25B (↓ 4%)
6) 2024P – $27B (↑ 8%)
7) 2025P – $26B (↓ 4%)
.png?width=1120&upscale=true&name=13B.3-2022C(Comcast).png)


