Seven big questions re: watching TV while driving:
1) What must happen for watching TV while driving to become a reality?
2) When will cars be fully self-driving?
3) How much time do we spend in our car?
4) What share of ad-supported time in cars is AM/FM radio?
5) What share of cars sold are connected?
6) Who controls the car interface?
7) How much data will connected cars create daily?
Setting the table: Time spent watching TV has been flat (↑ 27m) for 15 years while mobile/desktop video has added 1h 9m.
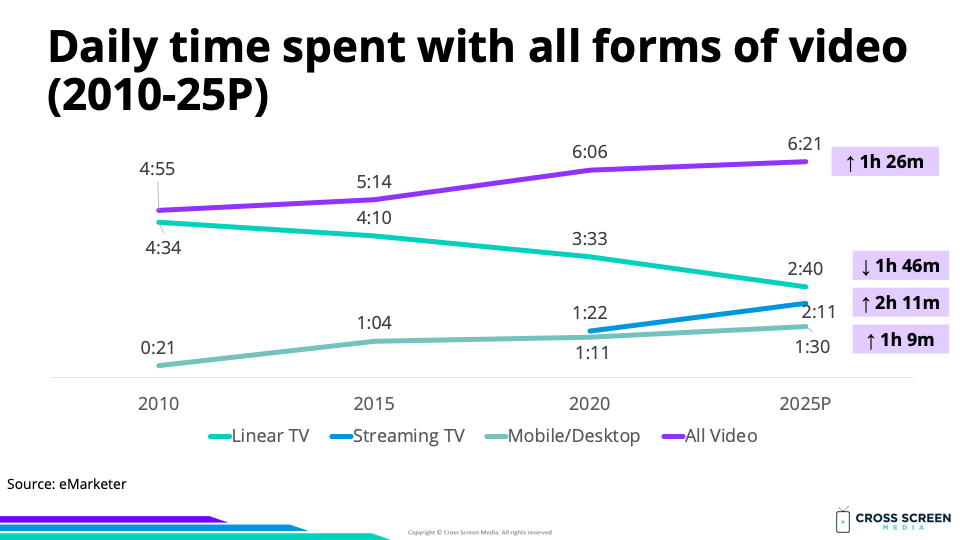
Why this matters: Self-driving cars could create new time for consuming video.
Quote from Ky Tang – Executive Director @ Telenav:
“We see this as the battle for the fourth screen after the television, computer and mobile phone.”
Big question #1: What must happen for watching TV while driving to become a reality?
Quick answer: Fully autonomous driving.
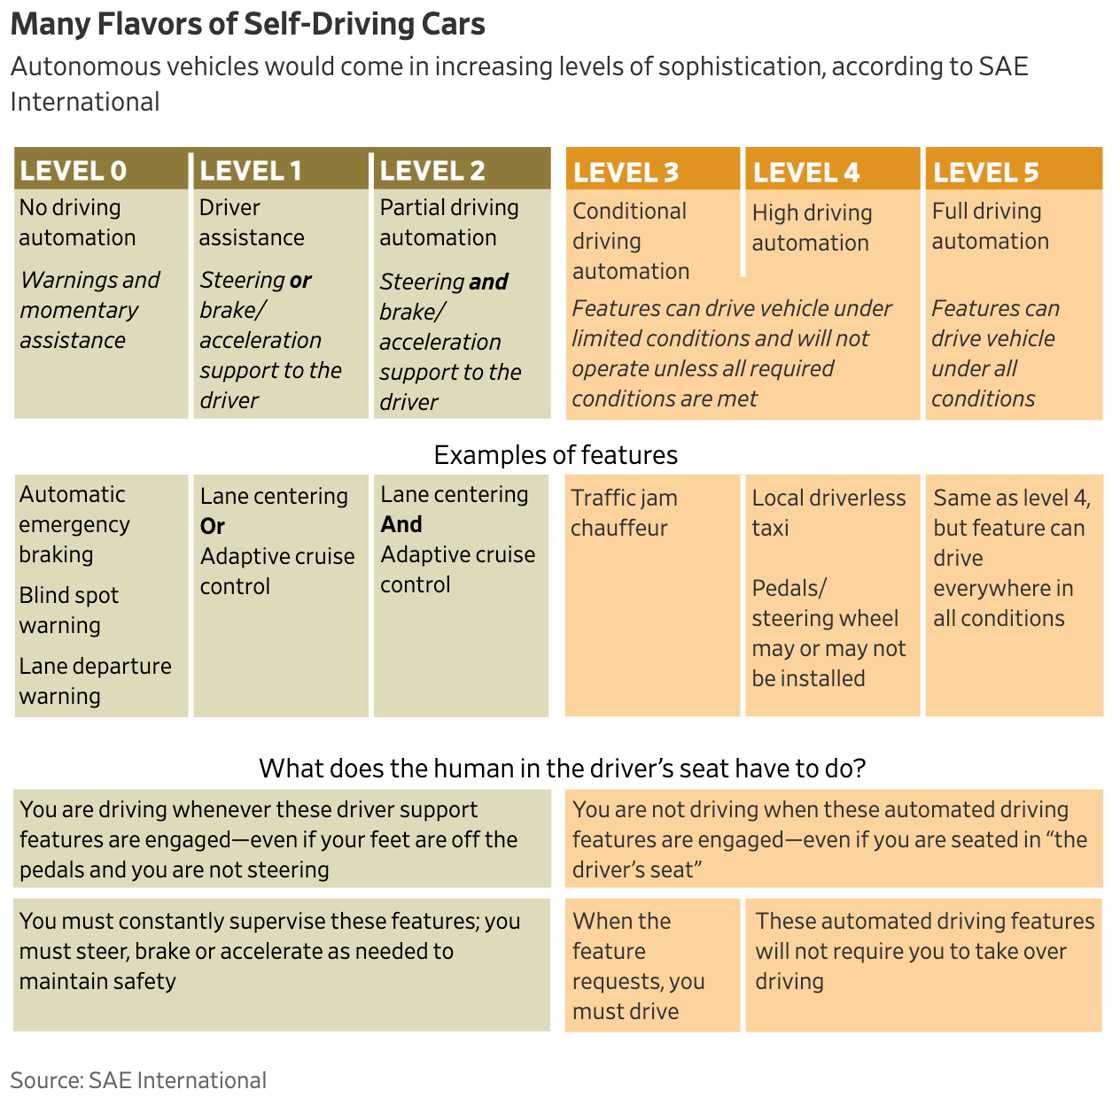
Big question #2: When will cars be fully self-driving?
Quick answer: Full autonomy (level 5) could be here as early as 2050.
Big question #3: How much time do we spend in our car?
Quick answer: 51 minutes per day
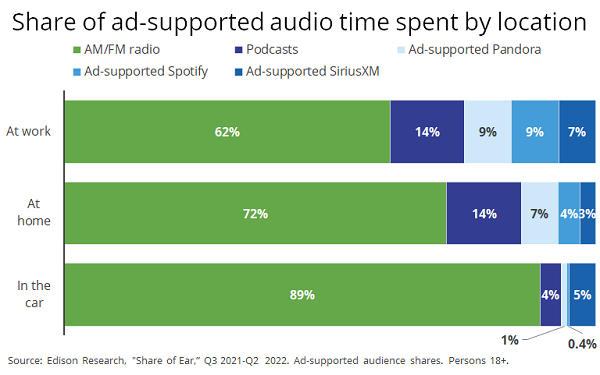
Big question #4: What share of ad-supported time in cars is AM/FM radio?
Quick answer: AM/FM radio dominates ad-supported time in cars.
Why this matters: Would introducing video be additive or a direct substitute for audio?
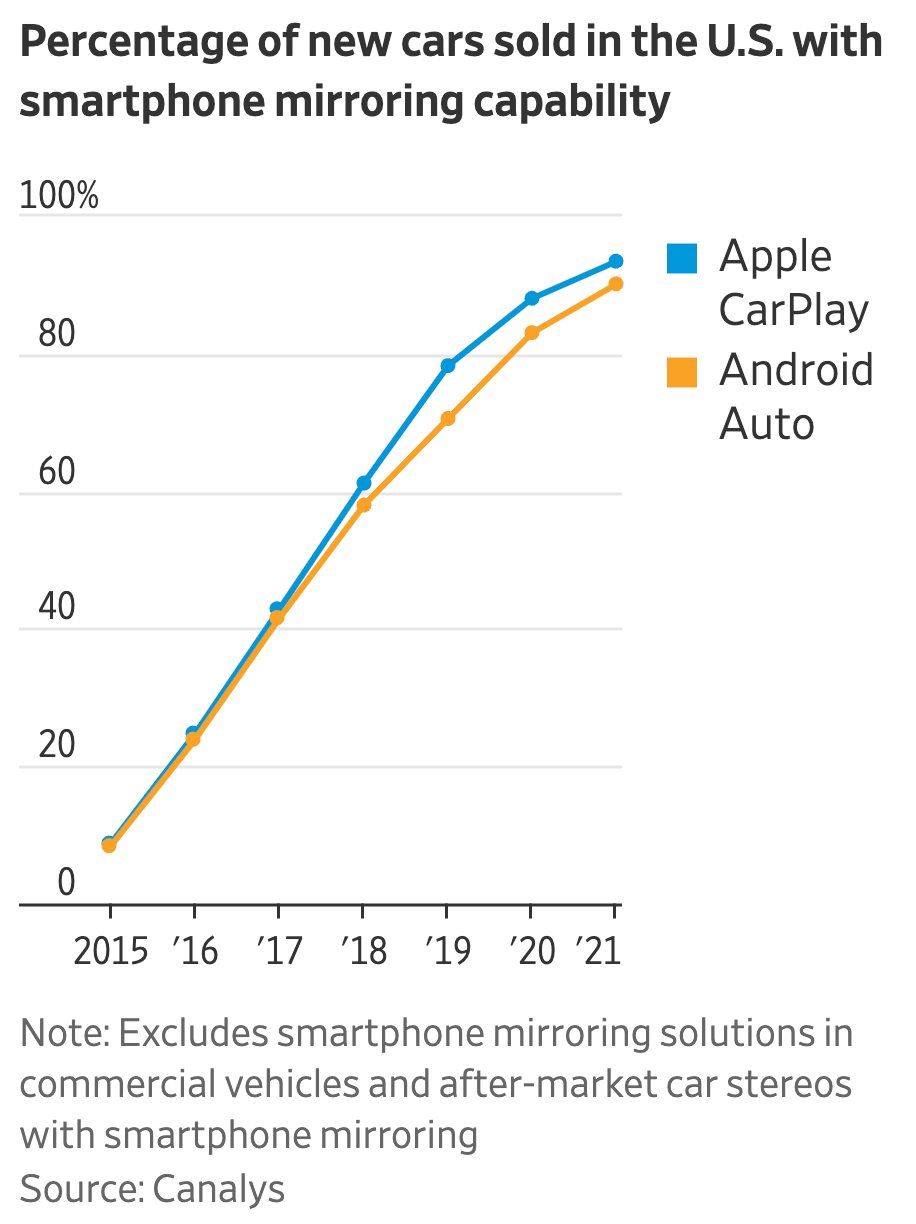
Big question #5: What share of cars sold are connected?
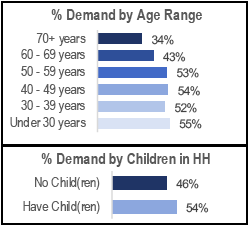
Quick answer: 98% of new cars sold in the US have Apple CarPlay and/or Android Auto.
Interesting: Apple CarPlay and/or Android Auto is a key feature for 48% of car buyers.
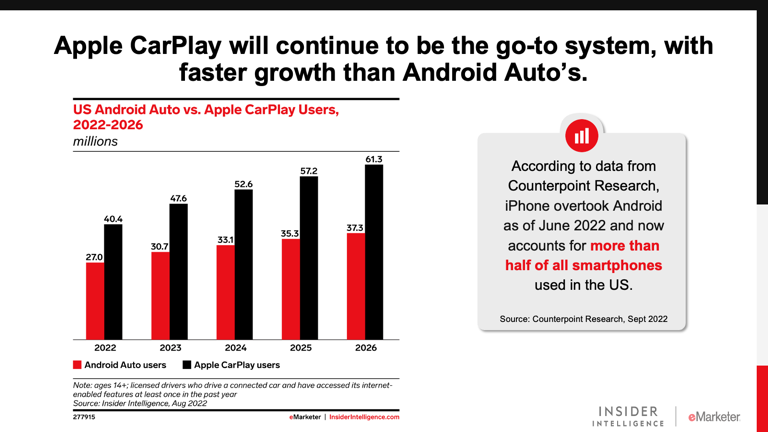
Big question #6: Who controls the car interface?
Share of connected car users by operating system according to eMarketer:
1) Apple CarPlay – 61%
2) Android Auto – 39%
Big question #7: How much data will connected cars create daily?
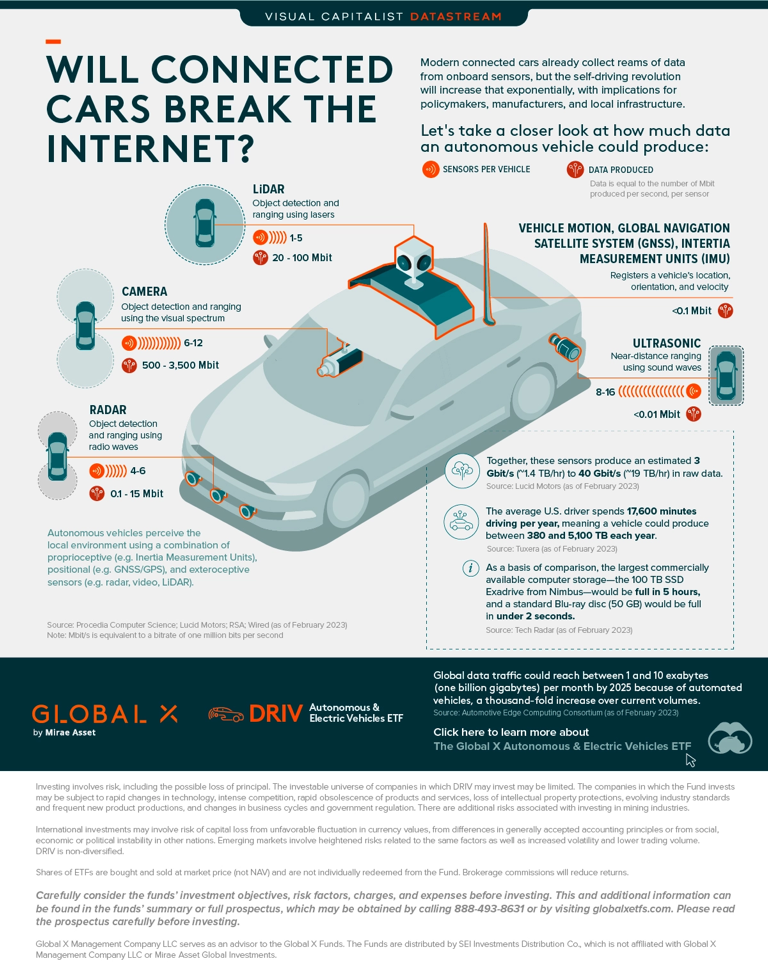
Quick answer: A ton (1.4 TB+ per hour of driving.)
FYI: This would fill a Blu-ray disc (50 GB) in less than 2 minutes!
Quick math on potential connected car data for the average driver:
1) 17,600 miles/year
2) 51 minutes/day
3) 310 hours/year
4) 1.4 – 19.0 TB per hour
5) 434 – 6K TB per year
More: Visualizing Media

