5 big questions re: how we watch video:
1) How much time do we spend online?
2) What share of our online time is spent with video?
3) Which streaming apps account for the highest share of total TV?
4) Do men or women spend more time streaming TV?
5) What share of the population watches streaming content daily?
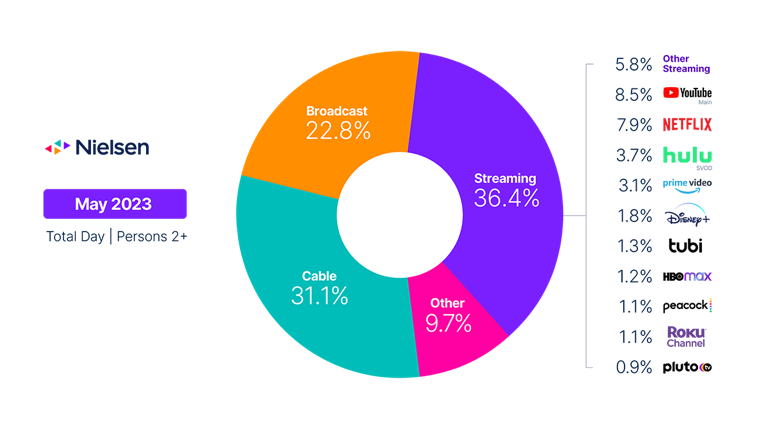
Setting the table: Streaming grew its share of time again in May, driven, in part, by ad-supported streaming services (FAST) such as the Roku Channel, which broke 1% share for the first time.
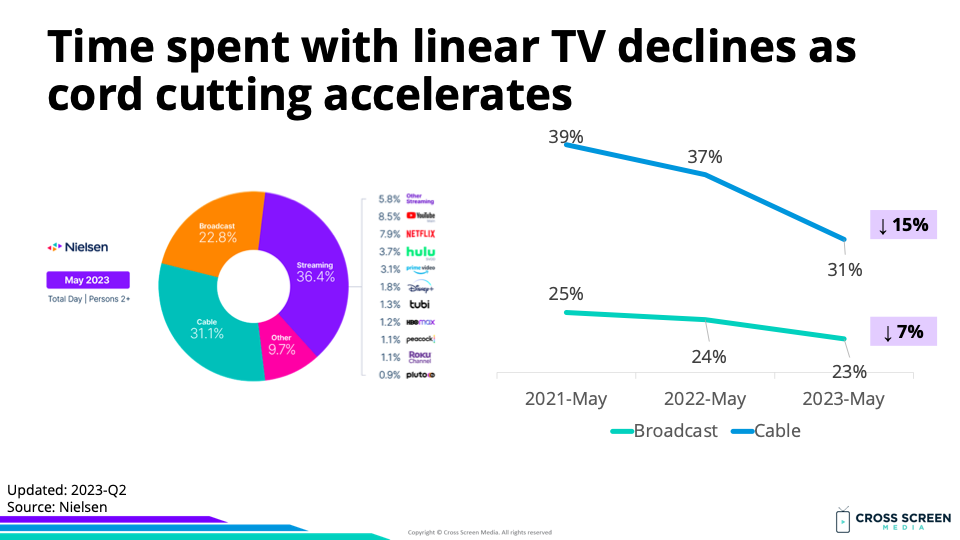
Share of total TV time according to Nielsen:
1) Streaming – 36%
2) Cable – 31%
3) Broadcast – 23%
4) Other – 10%
Big question #1: How much time do we spend online?
Quick answer: 7.5 hours per day
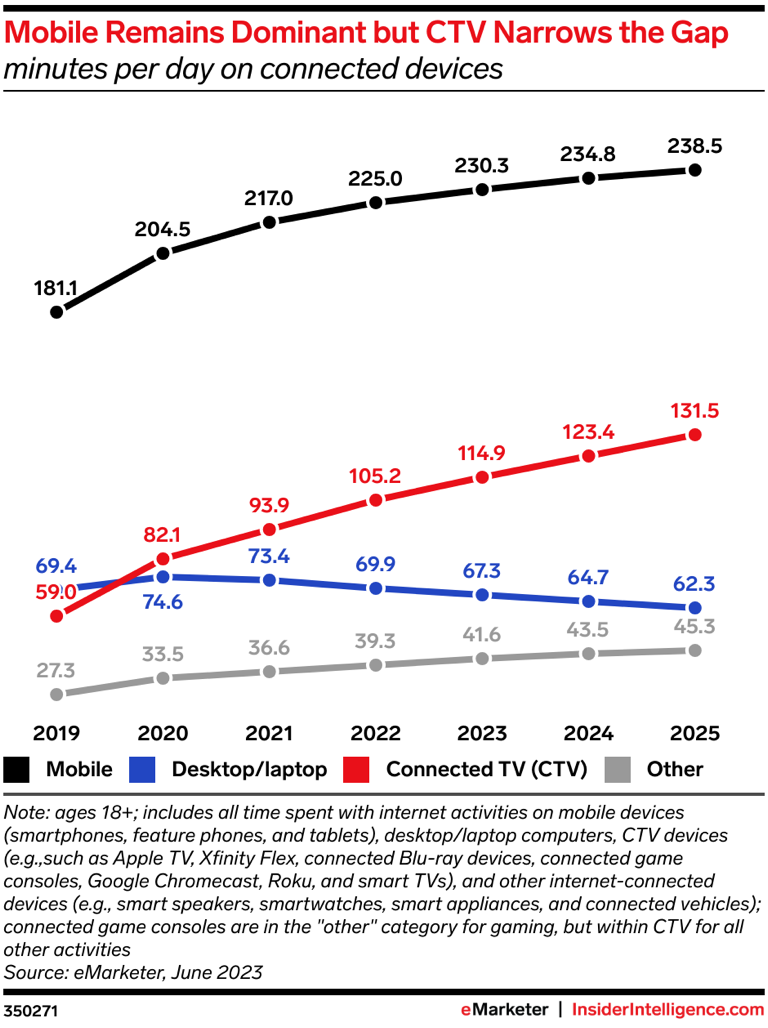
Share of time spent online by device according to eMarketer:
1) Mobile – 51%
2) CTV – 25%
3) Desktop/Laptop – 15%
4) Other – 9%
Big question #2: What share of our online time is spent with video?
Quick answer: 45%
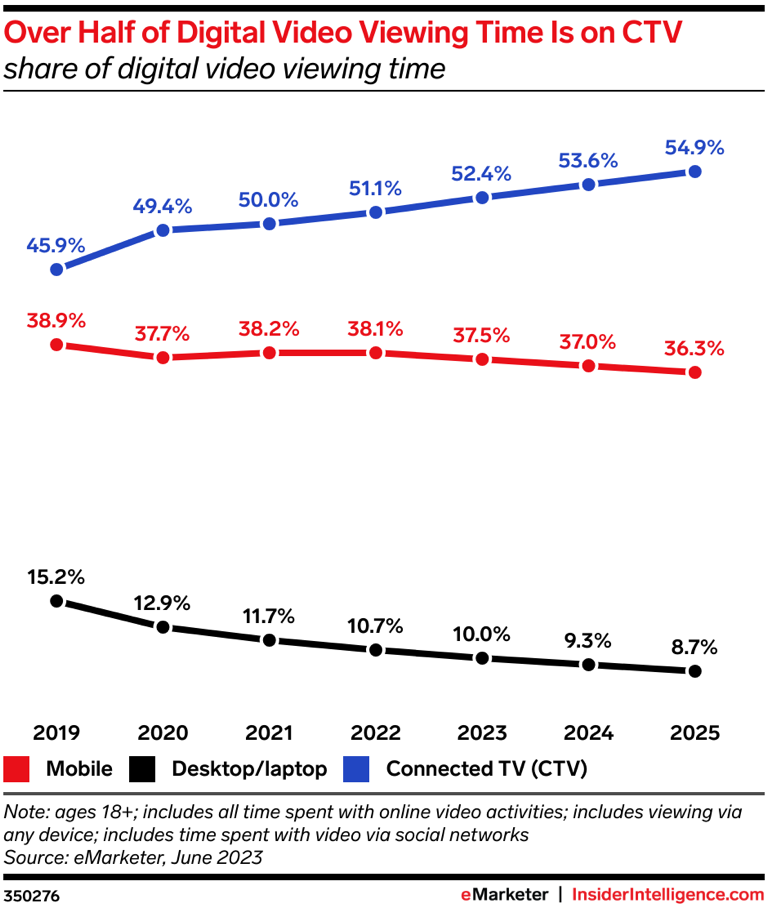
Share of time spent with digital video:
1) CTV – 52%
2) Mobile – 38%
3) Desktop/Laptop – 10%
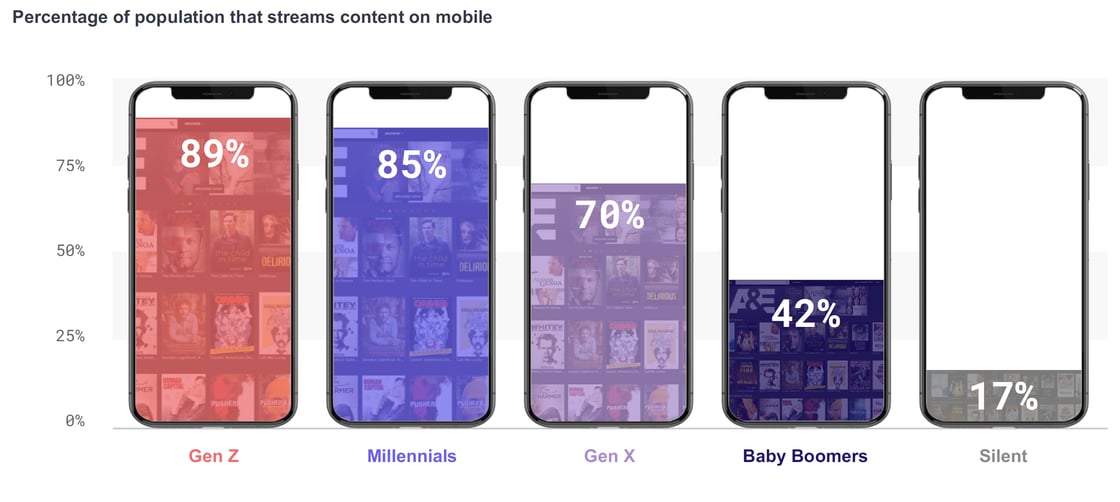
Share of population streaming video on mobile according to Samba TV:
1) Gen Z – 89%
2) Millennials – 85%
3) Gen X – 70%
4) Baby Boomers – 42%
5) Silent – 17%
Big question #3: Which streaming apps account for the highest share of total TV?
Share of total TV time (streaming only):
1) YouTube – 9%
2) Netflix – 8%
3) Hulu – 4%
4) Amazon Prime – 3%
5) Disney+ – 2%
6) Tubi – 1%
7) HBO Max – 1%
8) Peacock – 1%
9) Roku Channel – 1%
10) PlutoTV – 1%
11) Other – 6%
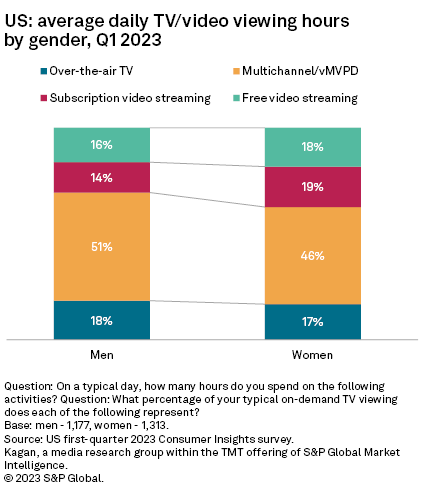
Big question #4: Do men or women spend more time streaming TV?
Quick answer: Women spend a 23% larger share (37% vs. 30%) of their TV time streaming than men.
Big question #5: What share of the population watches streaming content daily?
Quick answer: 49%
Share of the population watching streaming TV daily according to Leichtman Research Group:
1) 2015 – 12%
2) 2016 – 19%
3) 2017 – 25%
4) 2018 – 29%
5) 2019 – 31%
6) 2020 – 40%
7) 2021 – 39%
8) 2022 – 46%
9) 2023 – 49%

