Eight big questions re: Disney streaming:
1) How much revenue is Disney generating from streaming/direct-to-consumer?
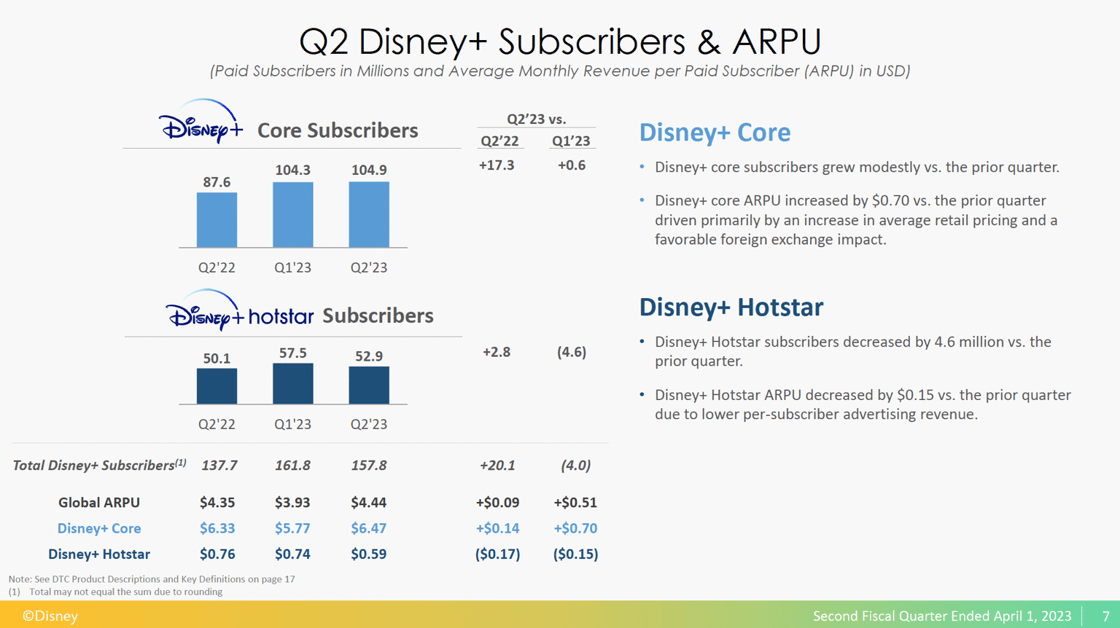
2) How many people subscribe to Disney’s streaming services?
3) What share of Disney+ signups are international?
4) How much money do they currently make from each streaming subscriber?
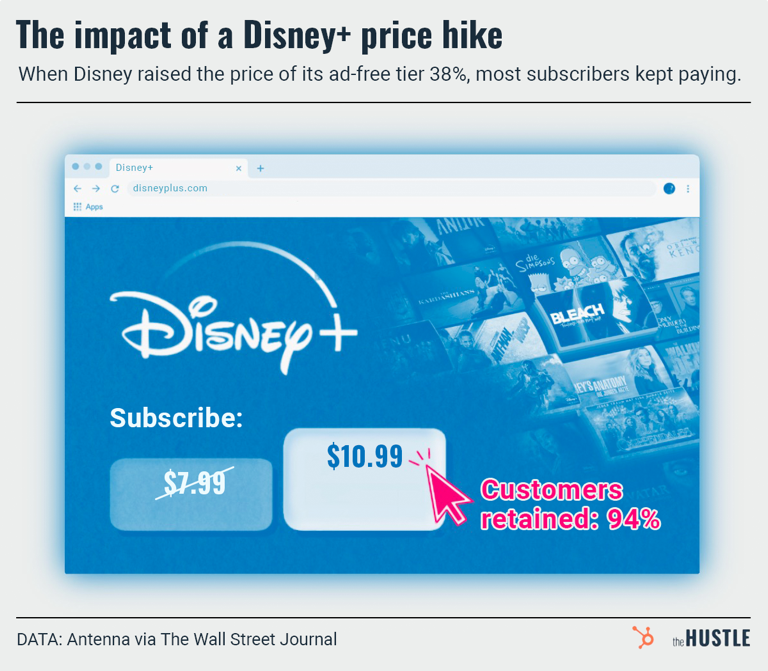
5) Are Disney+ price hikes driving cancellations?
6) What share of total TV time do Disney+ and Hulu account for?
7) What share of total TV time does Hulu live account for?
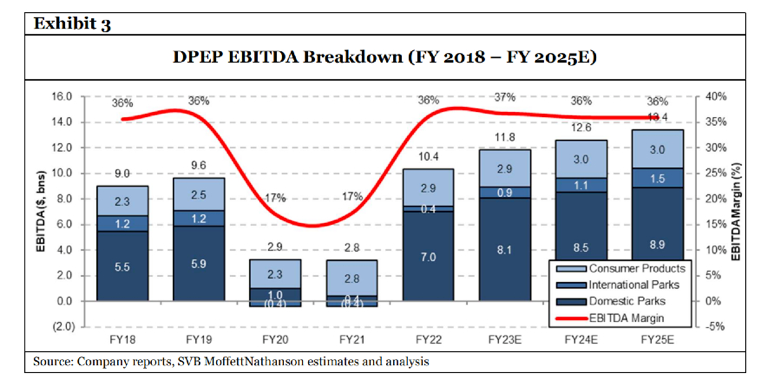
8) How much would Disney’s theme parks be worth as a standalone business?
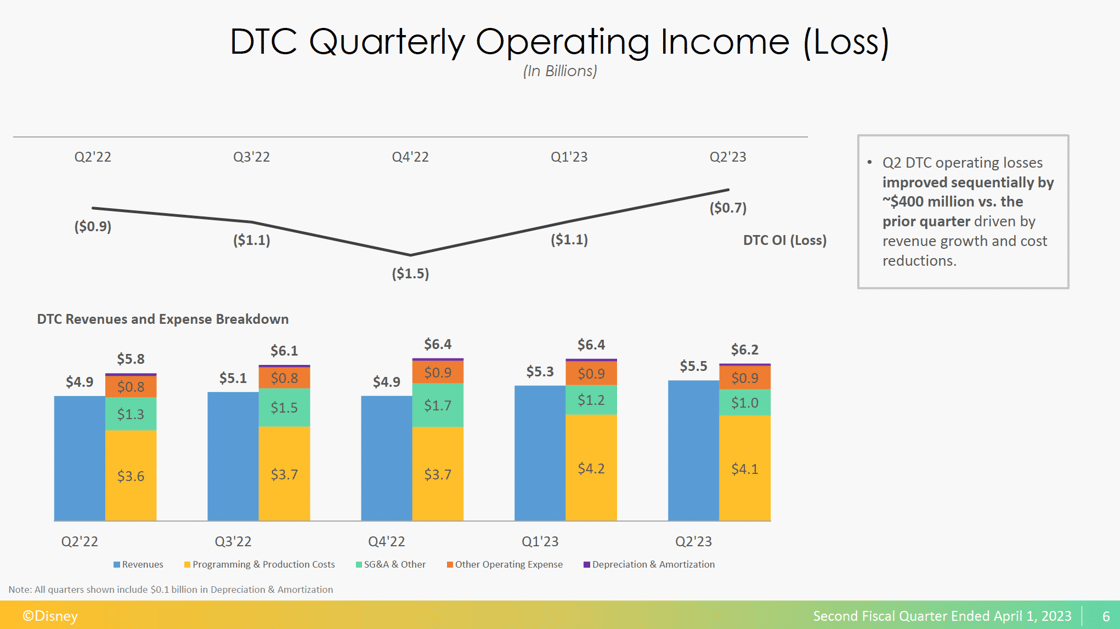
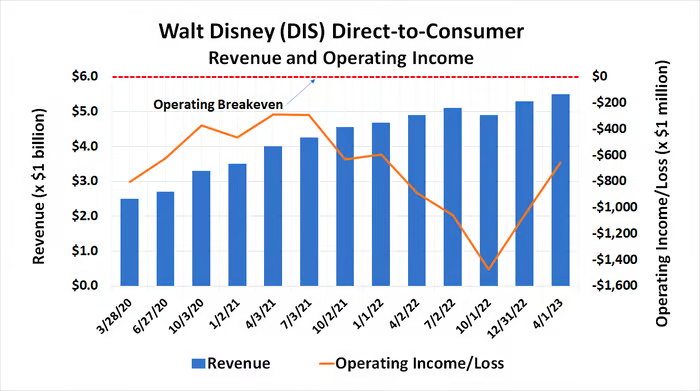
Big question #1: How much revenue is Disney generating from streaming/direct-to-consumer (DTC)?
Disney streaming/DTC revenue (YoY growth):
1) 2022-Q1 – $4.9B
2) 2023-Q1 – $5.5B (↑ 12%)
Disney streaming/DTC profit (YoY growth):
1) 2022-Q1 – ($887M)
2) 2023-Q1 – ($659M) (↑ 26%)
Quote from Tom Rogers – Former Chief Strategist @ NBC:
“They’re not at the precipice yet but those declines are precipitous. And while we’ve seen the whole streaming analyst world moved from sub numbers to the question of profitability, where it hasn’t moved yet and where all the media companies need to be pressed is: Is the growth of streaming as it moves toward profitability ever going to make up for the decline in the traditional television business? No one has really demonstrated yet how they believe the hole left by the decline of legacy media is going to be made up by streaming. And until that happens, it’s really hard to get too excited about anything on the streaming side, because that’s the essential question.”
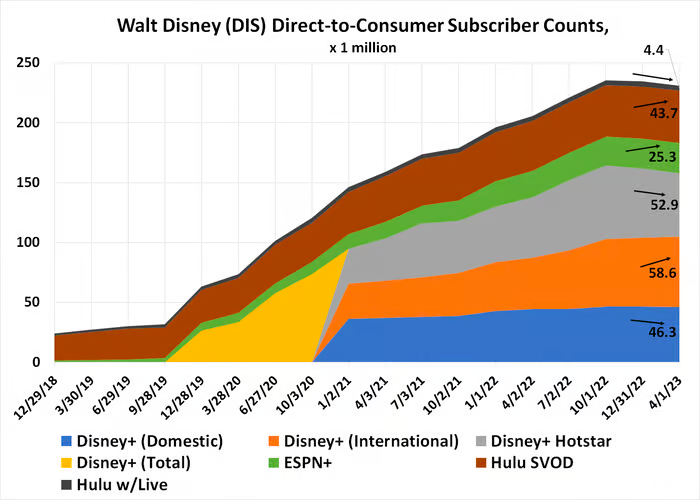
Big question #2: How many people subscribe to Disney’s streaming services?
Disney+ subscribers (YoY growth):
1) 2020-Q1 – 54.5M
2) 2021-Q1 – 103.6M (↑ 90%)
3) 2022-Q1 – 137.7M (↑ 33%)
4) 2023-Q1 – 157.8M (↓ 2%)
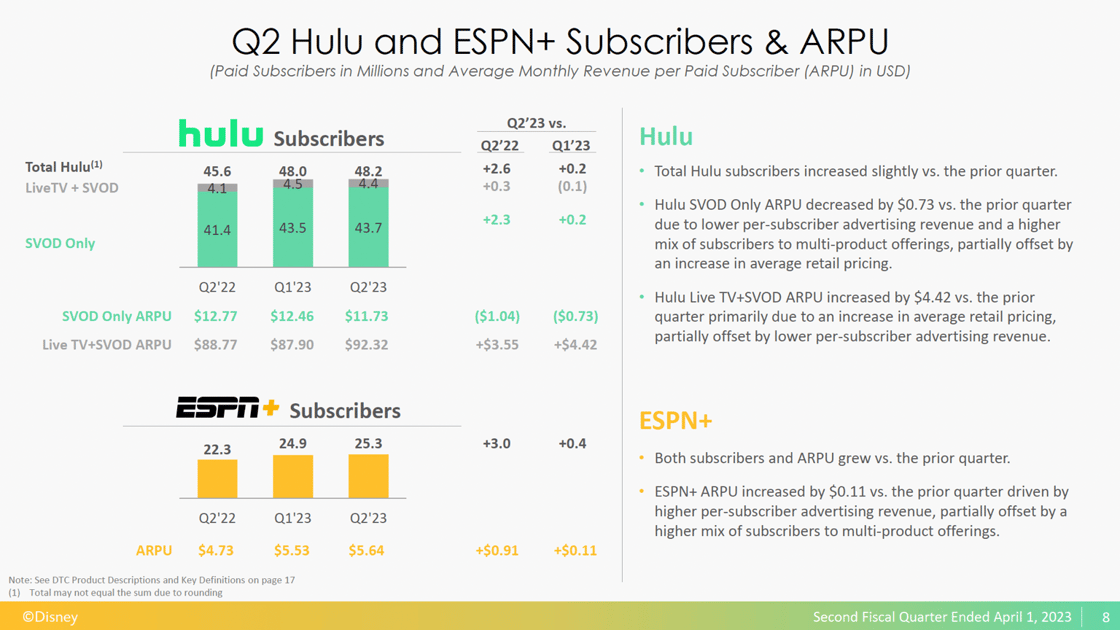
Disney streaming subscribers by platform (% of total):
1) Disney+ – 157.8M (68%)
2) Hulu – 48.2M (21%)
3) ESPN+ – 25.3M (11%)
4) Total -I 231.3M
Total Disney streaming subscribers (YoY growth):
1) 2021-Q1 – 159.0M
2) 2022-Q1 – 205.6M (↑ 29%)
3) 2023-Q1 – 231.3M (↑ 13%)
Big question #3: What share of Disney+ signups are international?
Share of Disney+ subscribers outside U.S./Canada:
1) 2021-Q1 – 64%
2) 2022-Q1 – 68%
3) 2023-Q1 – 71%
Big question #4: How much money do they currently make from each streaming subscriber?
Monthly ARPU for Disney+ (YoY growth):
1) 2020-Q1 – $5.63
2) 2021-Q1 – $3.99 (↓ 29%)
3) 2022-Q1 – $4.35 (↑ 9%)
4) 2023-Q1 – $4.44 (↑ 2%)
Monthly ARPU for Hulu (SVOD only)(YoY growth):
1) 2020-Q1 – $12.06
2) 2021-Q1 – $12.08 (↑ 0%)
3) 2022-Q1 – $12.77 (↑ 6%)
4) 2023-Q1 – $11.73 (↓ 8%)
Monthly ARPU for Hulu (Live TV + SVOD)(YoY growth):
1) 2020-Q1 – $67.75
2) 2021-Q1 – $81.83 (↑ 21%)
3) 2022-Q1 – $88.77 (↑ 8%)
4) 2023-Q1 – $92.32 (↑ 4%)
Monthly ARPU for ESPN+ (YoY growth):
1) 2020-Q1 – $4.24
2) 2021-Q1 – $4.55 (↑ 7%)
3) 2022-Q1 – $4.73 (↑ 4%)
4) 2023-Q1 – $5.64 (↑ 19%)
Big question #5: Are Disney+ price hikes driving cancellations?
Quick answer: No. The 38% price hike led to 6% of accounts canceling.
Big question #6: What share of total TV time do Disney+ and Hulu account for?
Quick answer: Hulu and Disney+ account for 5% of total TV time and 15% of streaming TV time.
Big question #7: What share of total TV time does Hulu live account for?
Quick answer: Hulu Live accounts for 0.3% of total TV time and 0.6% of linear TV time.
Big question #8: How much would Disney’s theme parks be worth as a standalone business?
Quick answer: $105B or ≈ 46% of the entire value of the Walt Disney Company!
Quote from Tony Maglio – Executive Editor, Business @ IndieWire:
“Put another way, nearly three-quarters of Disney’s current value comes from its parks, experiences, and products. One quarter comes from the other two-thirds (organizationally, at least) of the company: entertainment (linear, streaming, and studios) and ESPN.”


.png?width=1120&upscale=true&name=27B3.8-MAR2023E(Disney).png)
.png?width=1120&upscale=true&name=27B3.8-MAR2023(Hulu).png)
