Five big questions re: the Super Bowl TV:
1) How many people watch the Super Bowl?
2) What share of Super Bowl viewership comes from streaming?
3) How much does running an ad during the Super Bowl cost?
4) What is the Super Bowl’s advertising revenue?
5) How many ads do we watch during the Super Bowl?
Big question #1: How many people watch the Super Bowl?
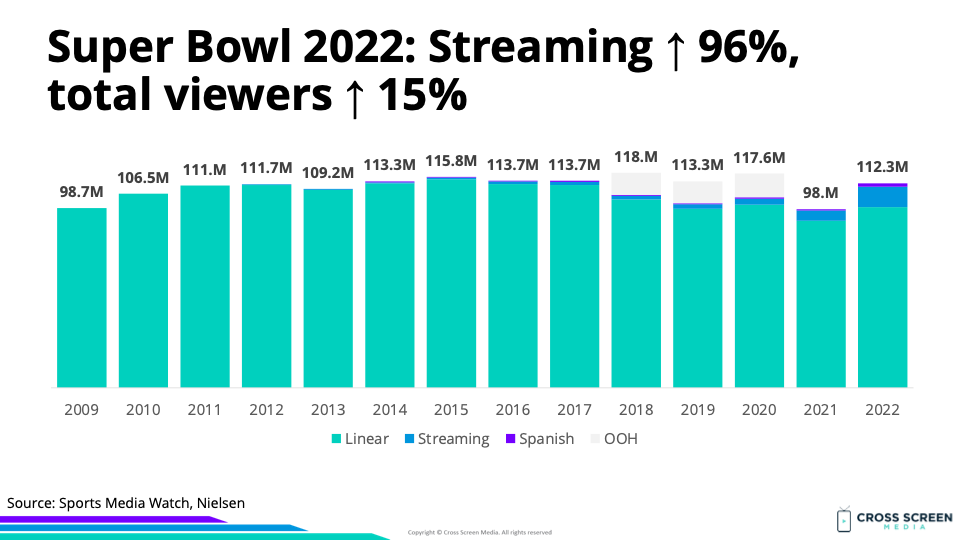
Total viewership for the past 10 Super Bowls (YoY growth) according to Sports Media Watch:
1) 2013 – BAL-SF (CBS) – 109.2M (↓ 2%)
2) 2014 – SEA-DEN (FOX) – 113.3M (↑ 4%)
3) 2015 – NE-SEA (NBC) – 115.8M (↑ 2%)
4) 2016 – DEN-CAR (CBS) – 113.7M (↓ 2%)
5) 2017 – NE-ATL (FOX) – 113.7M (↑ 0%)
6) 2018 – PHI-NE (NBC) – 118.0M (↑ 4%)
7) 2019 – NE-LAR (CBS) – 113.3M (↓ 4%)
8) 2020 – KC-SF (FOX) – 117.6M (↑ 4%)
9) 2021 – TB-KC (CBS) – 98.0M (↓ 17%)
10) 2022 – LAR-CIN (NBC) – 112.3M (↑ 15%)

Big question #2: What share of Super Bowl viewership comes from streaming?
Streaming viewership by year (YoY growth) according to Sports Media Watch:
1) 2013 – 508K (↑ 47%)
2) 2014 – 531K (↑ 5%)
3) 2015 – 973K (↑ 83%)
4) 2016 – 1.4M (↑ 44%)
5) 2017 – 1.7M (↑ 21%)
6) 2018 – 2.0M (↑ 19%)
7) 2019 – 2.6M (↑ 29%)
8) 2020 – 3.4M (↑ 31%)
9) 2021 – 5.7M (↑ 68%)
10) 2022 – 11.2M (↑ 96%)
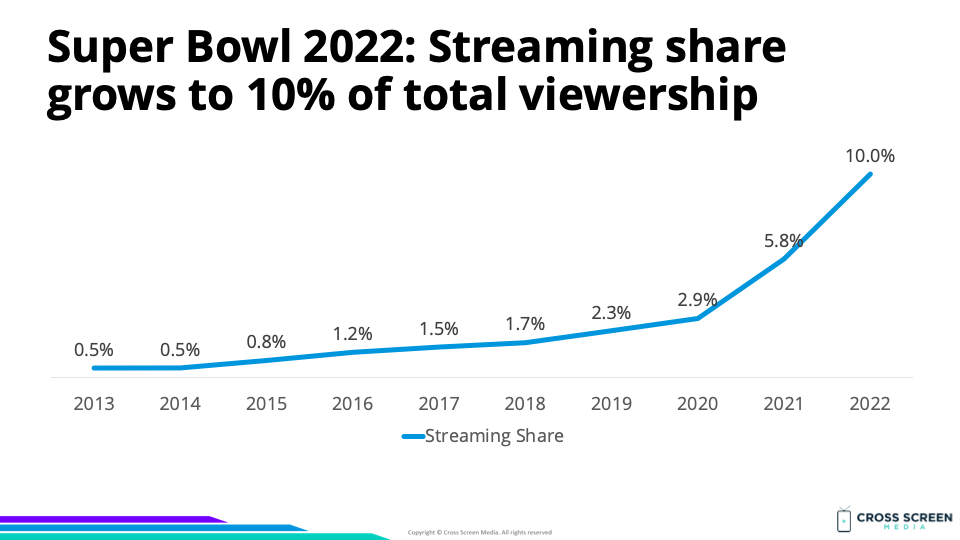
Streaming share of total viewership by year:
1) 2013 – 0.5%
2) 2014 – 0.5%
3) 2015 – 0.8%
4) 2016 – 1.2%
5) 2017 – 1.5%
6) 2018 – 1.7%
7) 2019 – 2.3%
8) 2020 – 2.9%
9) 2021 – 5.8%
10) 2022 – 10.0%

Mr. Screen‘s prediction #1: Total viewership increases 3% YoY (↑ 3.4M) to 115.7M.
Mr. Screen‘s prediction #2: Total streaming grows 30% YoY (3.4M), accounting for 12.6% of total viewership.
Big question #3: How much does running an ad during the Super Bowl cost?
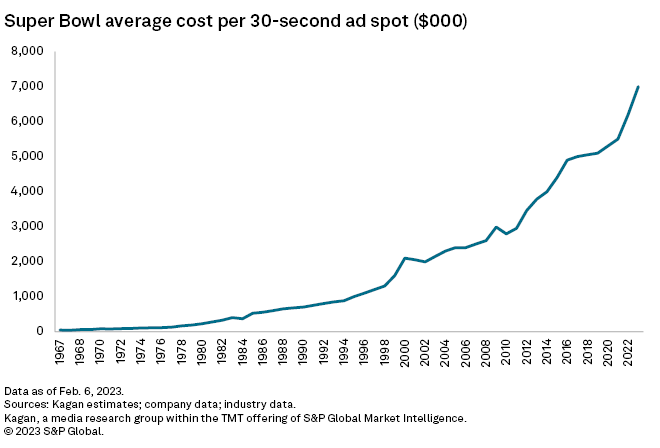
Estimated cost per 30s spot by year (YoY growth) according to Kagan:
1) 2013 – $3.9M (↑ 9%)
2) 2014 – $4.0M (↑ 6%)
3) 2015 – $4.4M (↑ 10%)
4) 2016 – $4.9M (↑ 11%)
5) 2017 – $5.0M (↑ 2%)
6) 2018- $5.1M (↑ 1%)
7) 2019 – $5.1M (↑ 1%)
8) 2020 – $5.3M (↑ 4%)
9) 2021 – $5.5M (↑ 4%)
10) 2022 – $6.2M (↑ 13%)
11) 2023P – ≈ $7.0M (↑ 13%)
Big question #4: What is the Super Bowl’s advertising revenue?
Super Bowl in-game ad spend by year (YoY growth) according to Kantar Media:
1) 2015 (NBC) – $322M
2) 2016 (CBS) – $376M (↑ 17%)
3) 2017 (FOX) – $430M (↑ 14%)
4) 2018 (NBC) – $341M (↓ 21%)
5) 2019 (CBS) – $339M (↓ 1%)
6) 2020 (FOX) – $449M (↑ 33%)
7) 2021 (CBS) – $435M (↓ 3%)
8) 2022 (NBC) – $578M (↑ 33%)
Big question #5: How many ads do we watch during the Super Bowl?
Quick answer: 68 ads during last year’s game.
Minutes of ads per Super Bowl (YoY growth) according to Kantar Media:
1) 2013 – 51:40
2) 2014 – 47:15 (↓ 9%)
3) 2015 – 48:05 (↑ 2%)
4) 2016 – 49:30 (↑ 3%)
5) 2017 – 51:30 (↑ 4%)
6) 2018 – 51:20 (↓ 0%)
7) 2019 – 49:31 (↓ 4%)
8) 2020 – 51:15 (↑ 4%)
9) 2021 – 42:00 (↓ 18%)
10) 2022 – 44:00 (↑ 5%)
More #1: How the Coin Toss Super Bowl Prop Was Invented
More #2: The world’s last Blockbuster has a Super Bowl commercial, but you won’t see it on TV during the game


