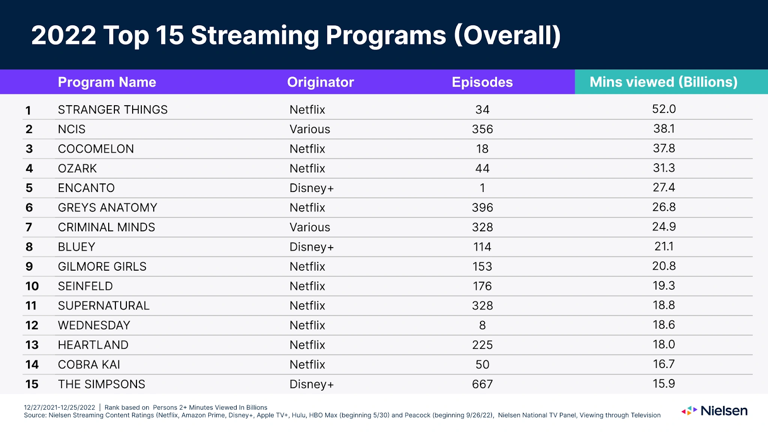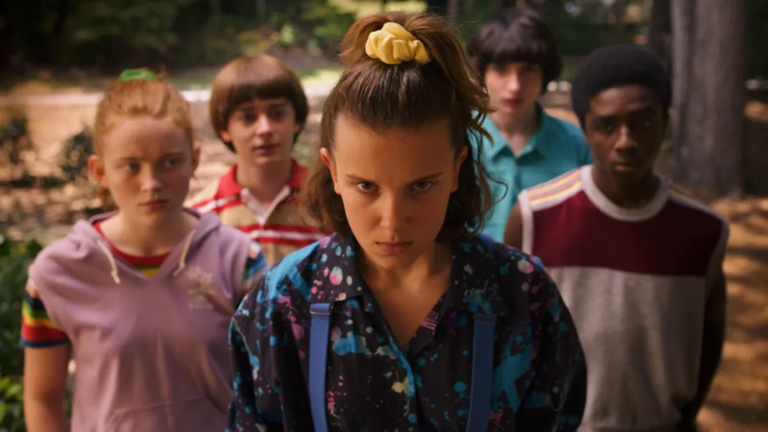
1) Stranger Things (Netflix) – 52B
2) NCIS (Netflix) – 38B
3) Cocomelon (Netflix) – 38B
4) Ozark (Netflix) – 31B
5) Encanto (Disney+) – 27B
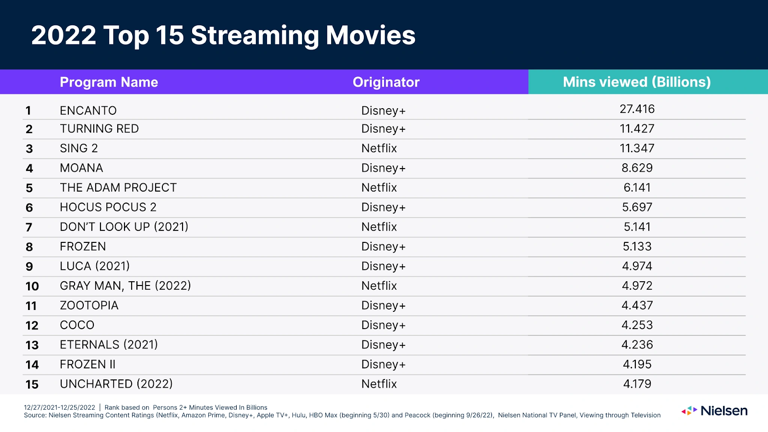
Top streaming movies by minutes viewed:
1) Encanto – 27B
2) Turning Red (Disney+) – 11B
3) Sing 2 (Netflix) – 11B
4) Moana (Disney+) – 9B
5) The Adam Project (Netflix) – 6B
Flashback: What Show Streamed More Than Squid Game?
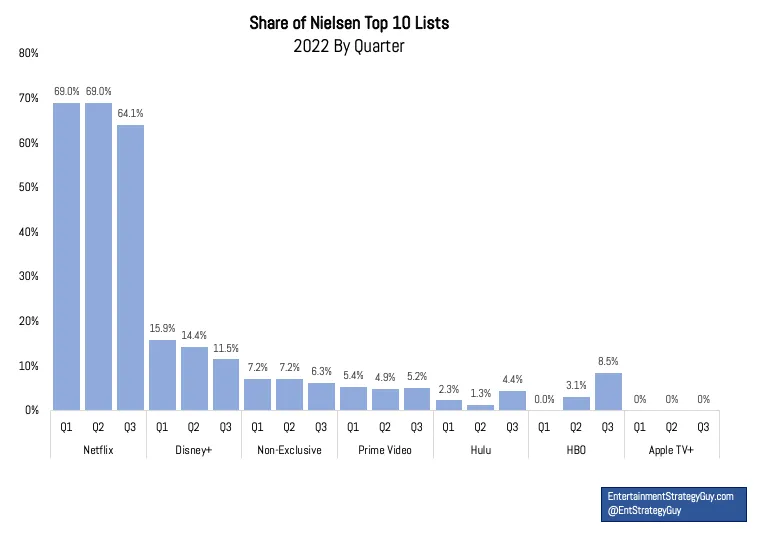
Wow: Netflix accounted for 64%+ of Nielsen’s top 10 lists through Q3!
Big question #2: What metric should media companies optimize for in 2023?
Quick answer: Attention/Time = Revenue. Revenue > Subscribers.
Quote from Tal Chalozin – Co-Founder and CTO @ Innovid:
“Get to translating – and get to focusing on time spent rather than simply scale. There’s an old line from the linear TV world: the business of TV isn’t about creating the best content; it’s about creating content that’s good enough for the audience to keep watching.”
Screen Wars Podcast: Innovid CTO Tal Chalozin On The New Normal of Digital Media
Big question #3: Did people spend more time streaming in 2022 vs. 2021?
Quick answer: Yes. 2.3T minutes more.(↑ 27%).
American’s time spent streaming (YoY growth) according to Nielsen:
1) 2021 – 15.3M years (7.9T minutes)
2) 2022 – 19.4M years (10.2T minutes) (↑ 27%)
Big question #4: What is the most popular streaming service for original series?
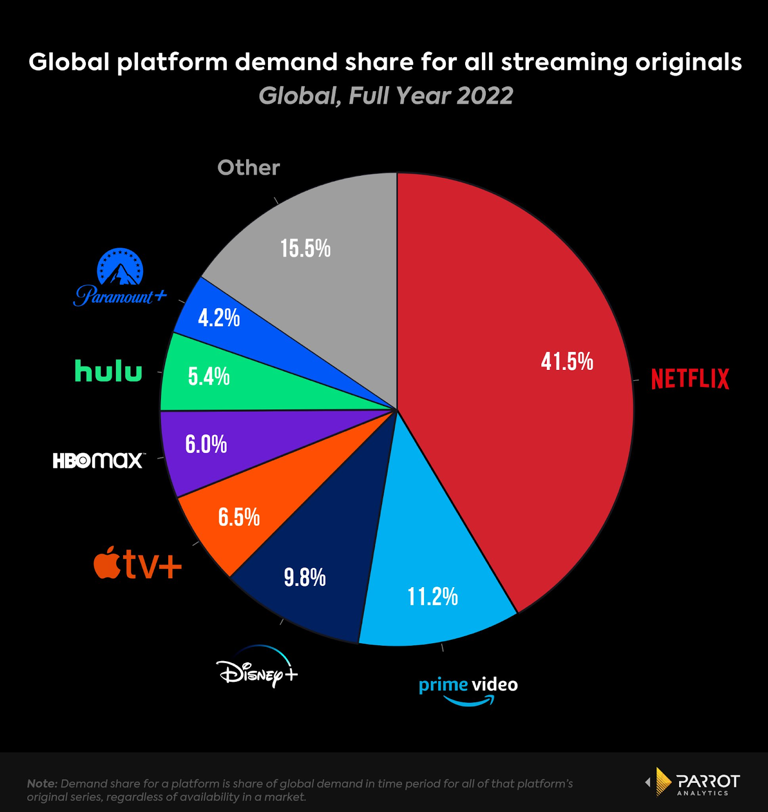
Share of demand for streaming originals according to Parrot Analytics:
1) Netflix – 42%
2) Amazon Prime – 11%
3) Disney+ – 10%
4) Apple TV+ – 7%
5) HBO Max – 6%
Screen Wars Podcast: Julia Alexander on the Impact of Ad-Supported Streaming

