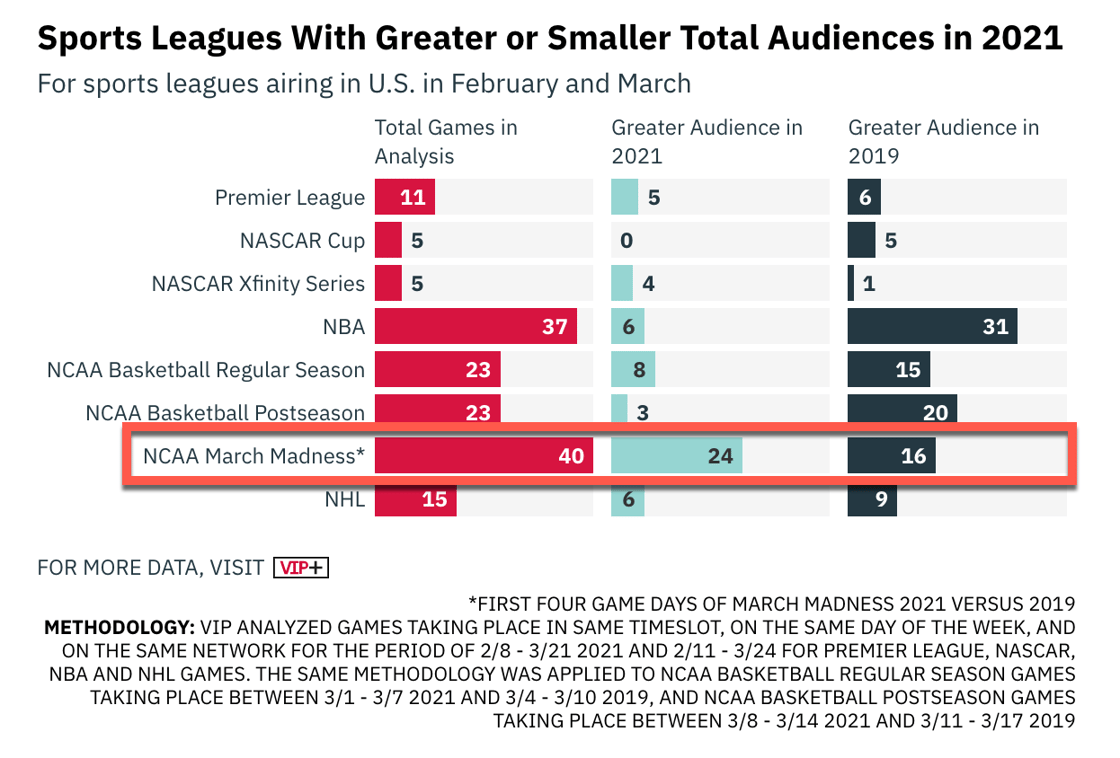
Average viewership for the first four days of March Madness according to Sports Business Journal:
1) 2019 – 8.8M
2) 2021 – 8.5M (↓ 3%)
Interesting: Even though average viewership was down 3%, 60% of games increased in 2021 vs. 2019.

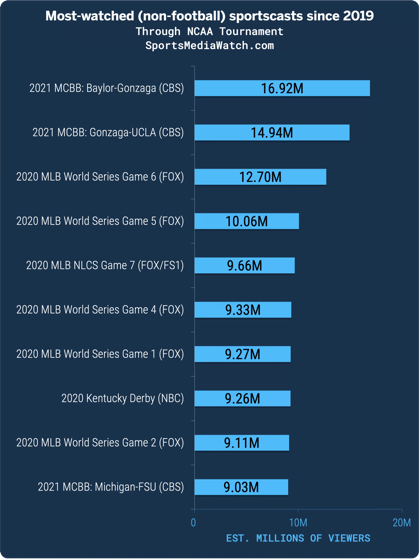
Total viewership for NCAA March Madness championship games (YoY growth) according to Sports Media Watch:
1) 2011 – UC-BU (CBS) – 20.1M (↓ 16%)
2) 2012 – UK-KU (CBS) – 20.9M (↑ 4%)
3) 2013 – UL-UM (CBS) – 23.4M (↑ 12%)
4) 2014 – UC-UK (CBS) – 21.2M (↓ 10%)
5) 2015 – DU-UW (CBS) – 28.3M (↑ 33%)
6) 2016 – VU-UNC (TBS) – 17.8M (↓ 37%)
7) 2017 – UNC-GU (CBS) – 23.0M (↑ 30%)
8) 2018 – VU-UM (TBS) – 16.5M (↓ 28%)
9) 2019 – VTU-TTU (CBS) – 19.6M (↑ 19%)
10) 2021 – BAY-GON (CBS) – 16.9M (↓ 14%)


